- Home >
- Stock Photos >
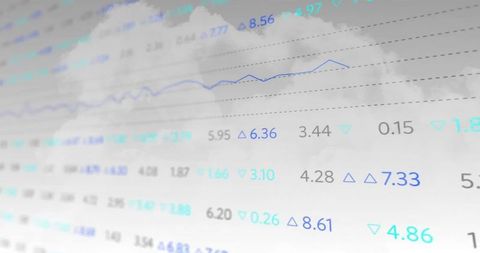
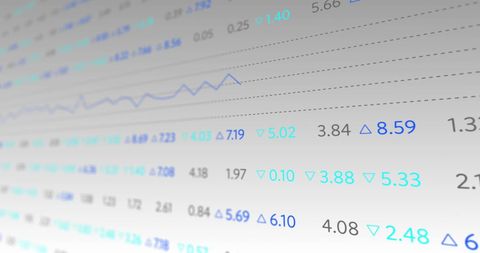
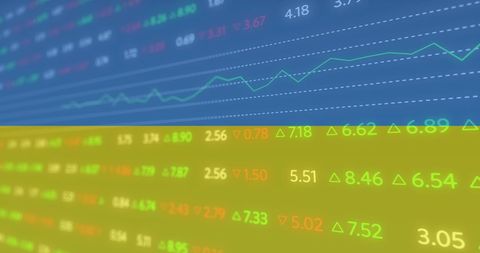
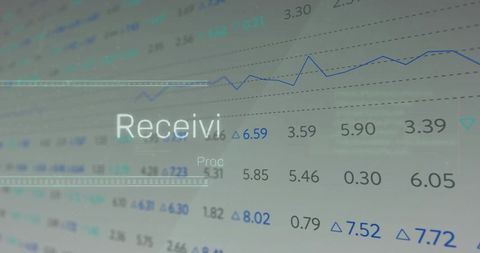
- Financial Data Analysis with Graph Overlays on Red Background
Financial Data Analysis with Graph Overlays on Red Background Image

Visualizing financial data with graphs overlaid on red background. Ideal for use in finance-related articles, presentations on market trends, and resources focused on data analysis. Can also be used for educational content related to trading or economics.

downloads
Tags:
More
Credit Photo
If you would like to credit the Photo, here are some ways you can do so
Text Link
photo Link
<span class="text-link">
<span>
<a target="_blank" href=https://pikwizard.com/photo/financial-data-analysis-with-graph-overlays-on-red-background/fd31bb90e084f05dfb16d15d98dacd69/>PikWizard</a>
</span>
</span>
<span class="image-link">
<span
style="margin: 0 0 20px 0; display: inline-block; vertical-align: middle; width: 100%;"
>
<a
target="_blank"
href="https://pikwizard.com/photo/financial-data-analysis-with-graph-overlays-on-red-background/fd31bb90e084f05dfb16d15d98dacd69/"
style="text-decoration: none; font-size: 10px; margin: 0;"
>
<img src="https://pikwizard.com/pw/medium/fd31bb90e084f05dfb16d15d98dacd69.jpg" style="margin: 0; width: 100%;" alt="" />
<p style="font-size: 12px; margin: 0;">PikWizard</p>
</a>
</span>
</span>
Free (free of charge)
Free for personal and commercial use.
Author: Creative Art