- Home >
- Stock Photos >
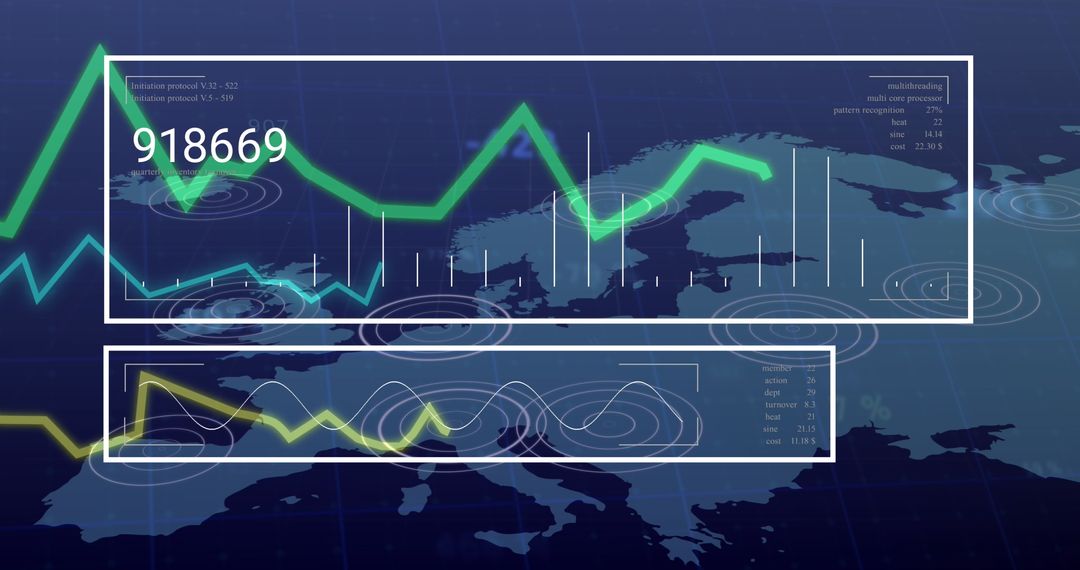
- Financial Data Analysis with Graphs and Charts in Blue
Financial Data Analysis with Graphs and Charts in Blue Image

Composite image shows various financial data elements such as line graphs, percentage figures, and pie charts in a digitally rendered environment. The predominant blue tones convey a sense of precision and modern technology, making this image suitable for illustrating concepts in financial technology (fintech), data analytics, and global business trends. This visual can be used in presentations, reports, and articles that focus on financial data analytics services and technologies impacting the business world.
Powered by 


2
downloads
downloads
Tags:
More
Credit Photo
If you would like to credit the Photo, here are some ways you can do so
Text Link
photo Link
<span class="text-link">
<span>
<a target="_blank" href=https://pikwizard.com/photo/financial-data-analysis-with-graphs-and-charts-in-blue/f5629e2508783a0f348adb9b3c420bac/>PikWizard</a>
</span>
</span>
<span class="image-link">
<span
style="margin: 0 0 20px 0; display: inline-block; vertical-align: middle; width: 100%;"
>
<a
target="_blank"
href="https://pikwizard.com/photo/financial-data-analysis-with-graphs-and-charts-in-blue/f5629e2508783a0f348adb9b3c420bac/"
style="text-decoration: none; font-size: 10px; margin: 0;"
>
<img src="https://pikwizard.com/pw/medium/f5629e2508783a0f348adb9b3c420bac.jpg" style="margin: 0; width: 100%;" alt="" />
<p style="font-size: 12px; margin: 0;">PikWizard</p>
</a>
</span>
</span>
Free (free of charge)
Free for personal and commercial use.
Author: Awesome Content
Similar Free Stock Images

Premium


Premium


Premium


Premium


Premium


Premium


Premium


Premium


Premium


Premium


Premium


Premium


Premium


Premium


Premium


Premium


Premium


Premium


Premium


Premium


Premium


Premium


Premium


Premium