- Home >
- Stock Photos >
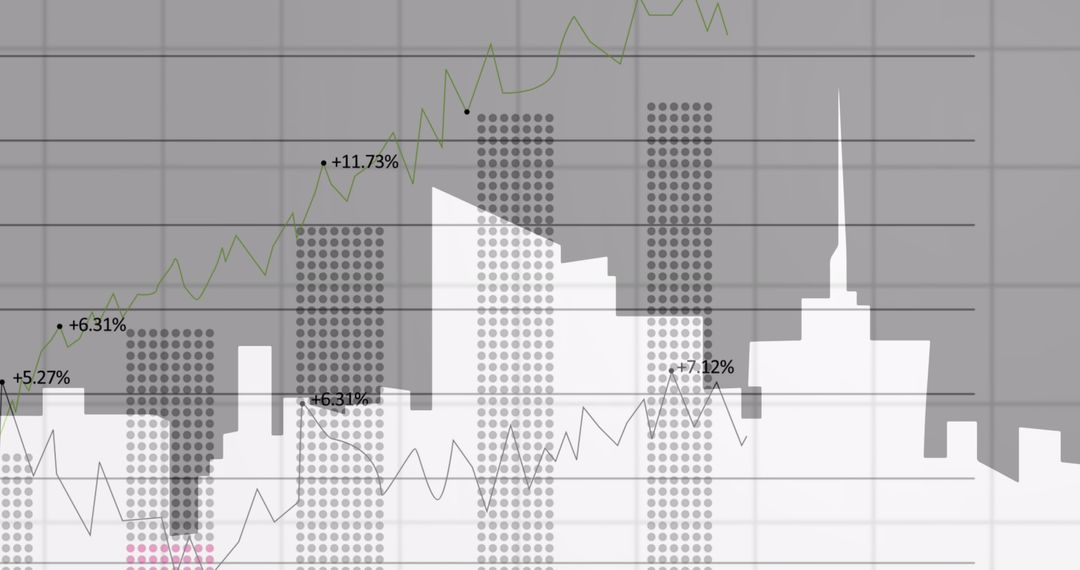
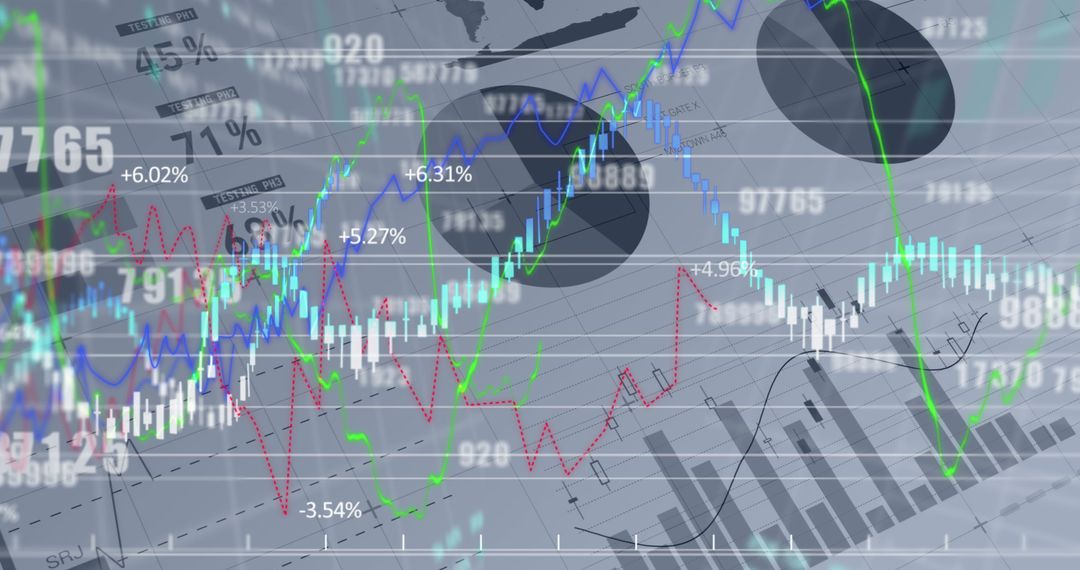
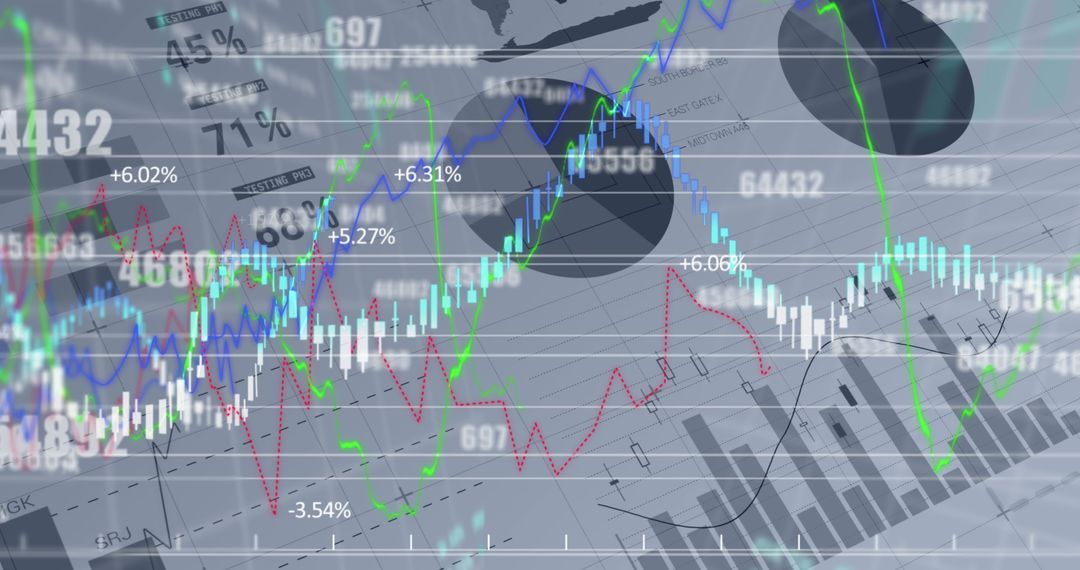
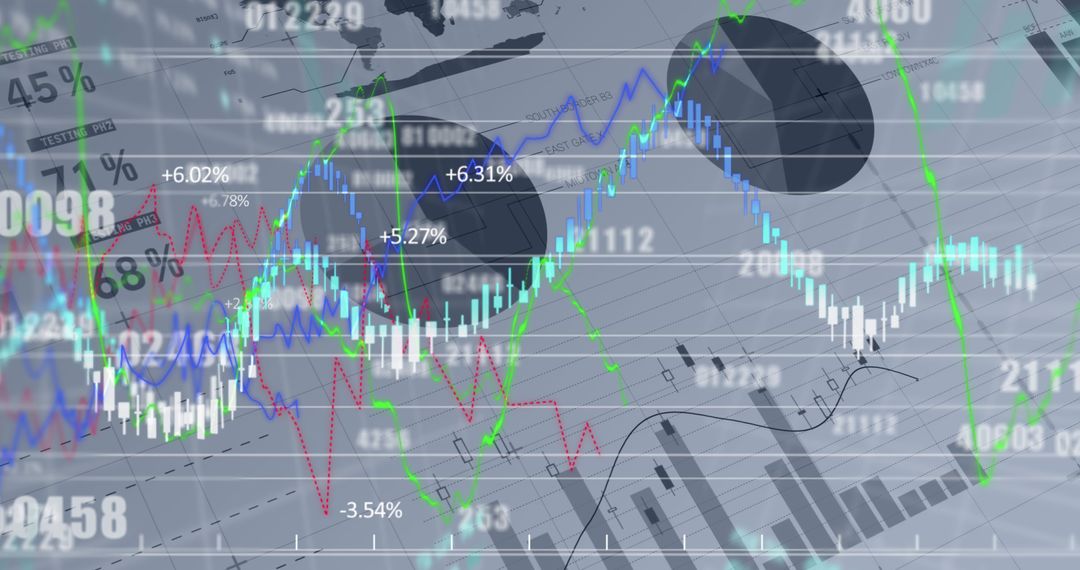
- Financial Data Analysis with Graphs and Charts on Abstract Grid
Financial Data Analysis with Graphs and Charts on Abstract Grid Image

Abstract depiction of financial data analysis with various graphs and charts over grid. Useful for conveying complex data processing concepts in business presentations or technology-focused materials. Ideal for illustrating market trends, finance, and global financial operations in business communications or educational materials.
Powered by  - Get 15% off with code: PIKWIZARD15


0
downloads
downloads
Tags:
More
Credit Photo
If you would like to credit the Photo, here are some ways you can do so
Text Link
photo Link
<span class="text-link">
<span>
<a target="_blank" href=https://pikwizard.com/photo/financial-data-analysis-with-graphs-and-charts-on-abstract-grid/70501c0e50b6fd1c2d51b468a0ccf05d/>PikWizard</a>
</span>
</span>
<span class="image-link">
<span
style="margin: 0 0 20px 0; display: inline-block; vertical-align: middle; width: 100%;"
>
<a
target="_blank"
href="https://pikwizard.com/photo/financial-data-analysis-with-graphs-and-charts-on-abstract-grid/70501c0e50b6fd1c2d51b468a0ccf05d/"
style="text-decoration: none; font-size: 10px; margin: 0;"
>
<img src="https://pikwizard.com/pw/medium/70501c0e50b6fd1c2d51b468a0ccf05d.jpg" style="margin: 0; width: 100%;" alt="" />
<p style="font-size: 12px; margin: 0;">PikWizard</p>
</a>
</span>
</span>
Free (free of charge)
Free for personal and commercial use.
Author: Authentic Images
Similar Free Stock Images

Premium


Premium


Premium


Premium


Premium


Premium


Premium


Premium


Premium


Premium


Premium


Premium


Premium


Premium


Premium


Premium


Premium


Premium


Premium


Premium


Premium


Premium


Premium


Premium