- Home >
- Stock Photos >
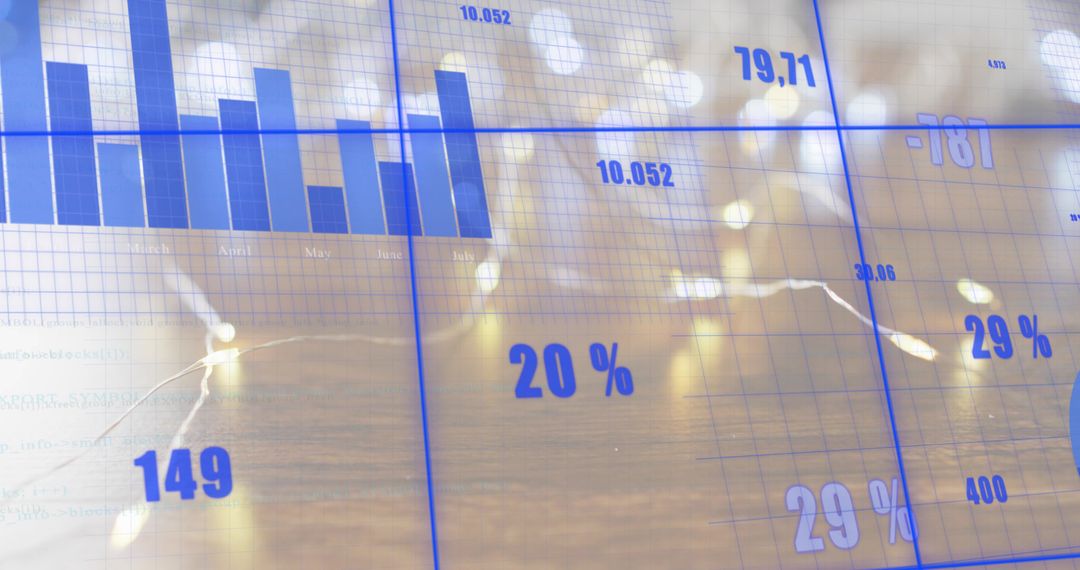
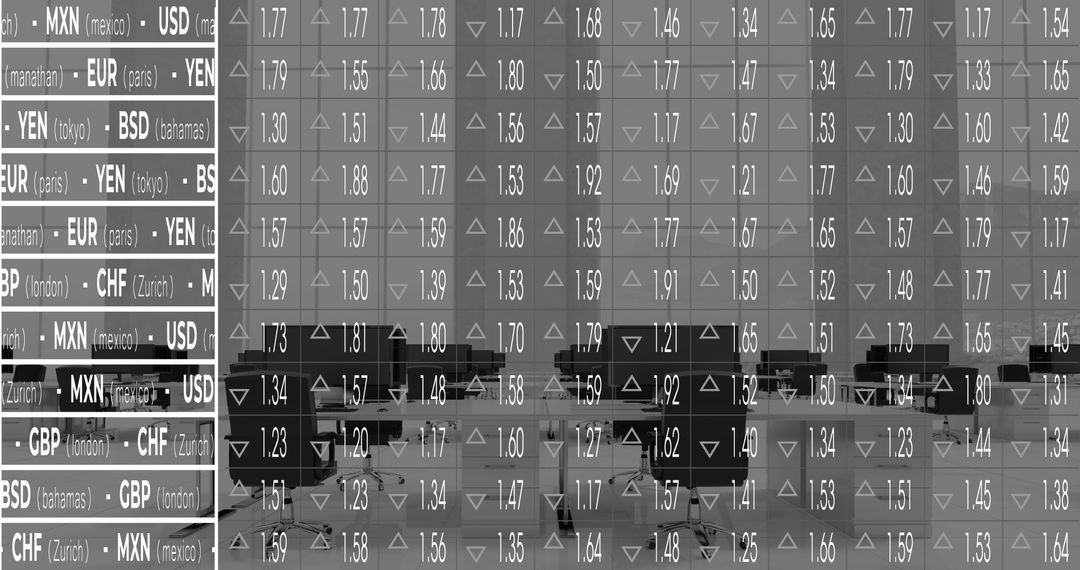
- Financial Data Analysis with Graphs and Statistics Overlay
Financial Data Analysis with Graphs and Statistics Overlay Image

Monochrome depiction of statistical data with overlays of financial graphs and bar charts. Represents complexities and dynamics of modern financial systems and global markets. Suitable for articles on market analysis, financial forecasts, business reports, or educational materials related to economics.
Powered by 


2
downloads
downloads
Tags:
More
Credit Photo
If you would like to credit the Photo, here are some ways you can do so
Text Link
photo Link
<span class="text-link">
<span>
<a target="_blank" href=https://pikwizard.com/photo/financial-data-analysis-with-graphs-and-statistics-overlay/386d46927608b83d9a535f82e4c39335/>PikWizard</a>
</span>
</span>
<span class="image-link">
<span
style="margin: 0 0 20px 0; display: inline-block; vertical-align: middle; width: 100%;"
>
<a
target="_blank"
href="https://pikwizard.com/photo/financial-data-analysis-with-graphs-and-statistics-overlay/386d46927608b83d9a535f82e4c39335/"
style="text-decoration: none; font-size: 10px; margin: 0;"
>
<img src="https://pikwizard.com/pw/medium/386d46927608b83d9a535f82e4c39335.jpg" style="margin: 0; width: 100%;" alt="" />
<p style="font-size: 12px; margin: 0;">PikWizard</p>
</a>
</span>
</span>
Free (free of charge)
Free for personal and commercial use.
Author: Authentic Images
Similar Free Stock Images

Premium


Premium


Premium


Premium


Premium


Premium


Premium


Premium


Premium


Premium


Premium


Premium


Premium


Premium


Premium


Premium


Premium


Premium


Premium


Premium


Premium


Premium


Premium


Premium