- Home >
- Stock Photos >
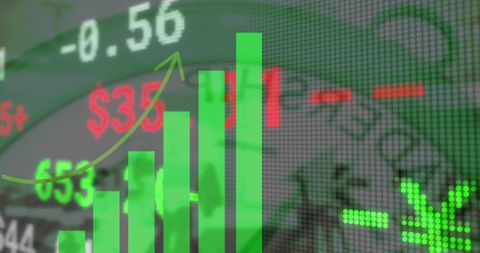
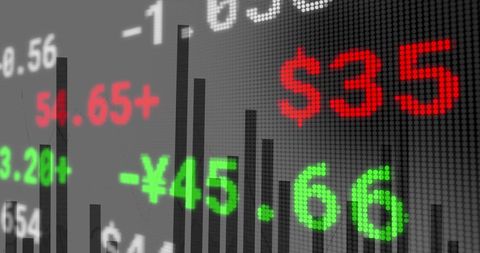
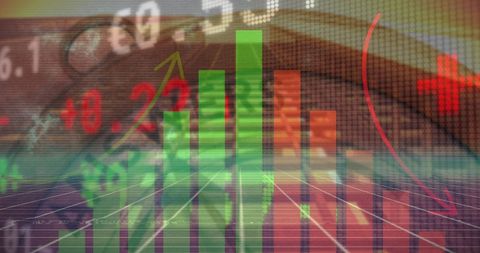
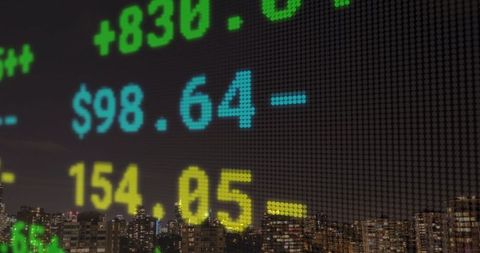
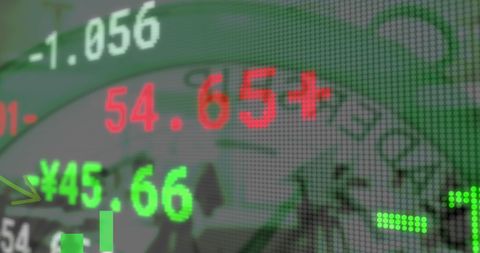
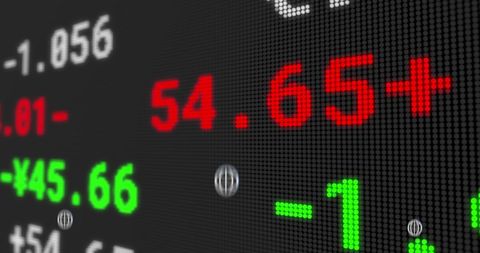
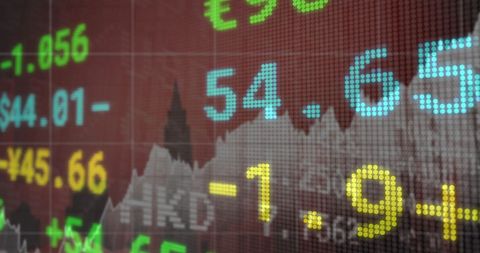
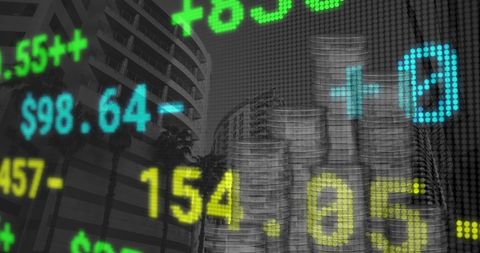
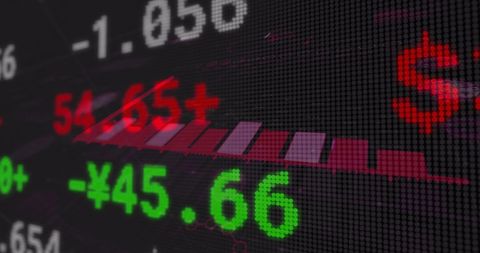
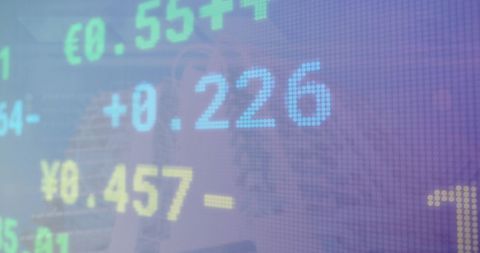
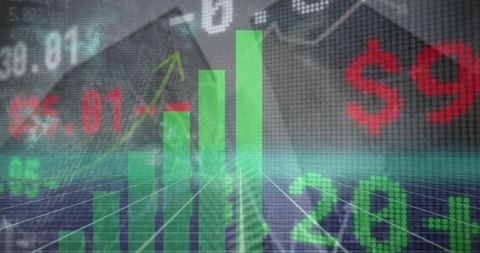
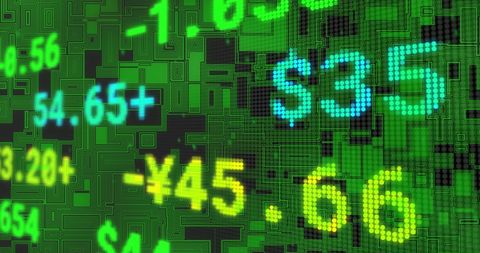
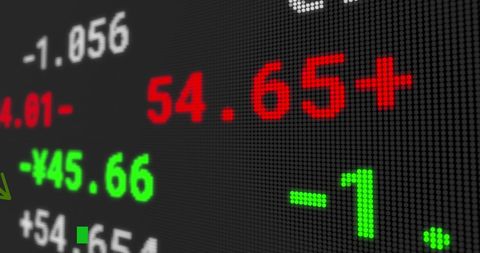
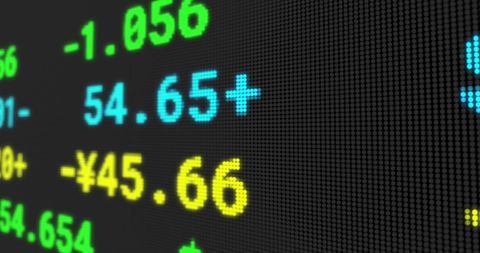
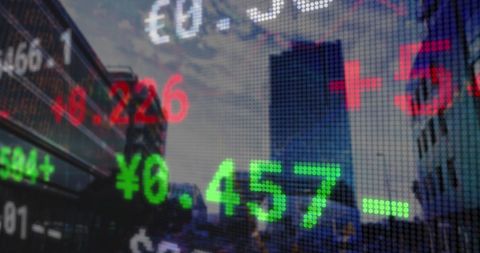
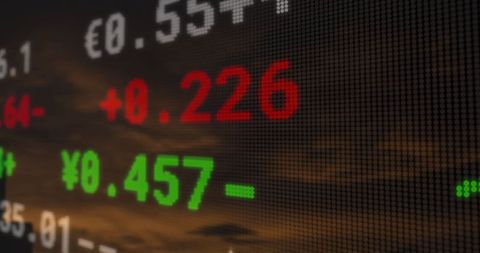
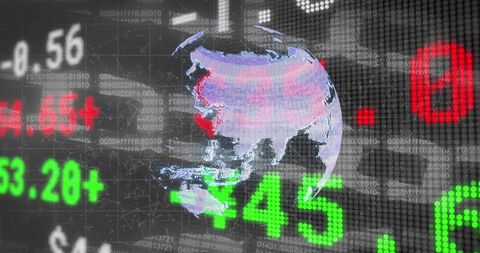
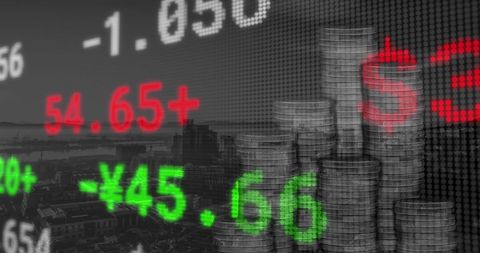
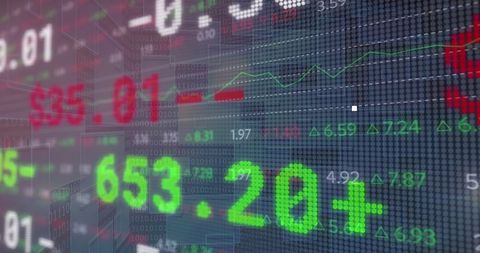
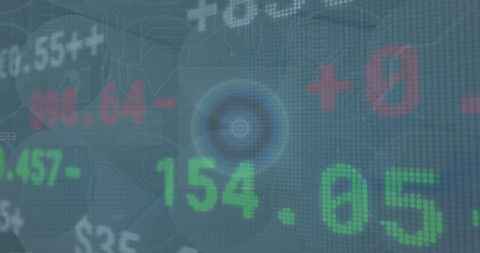
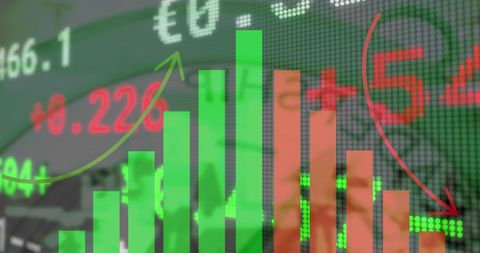
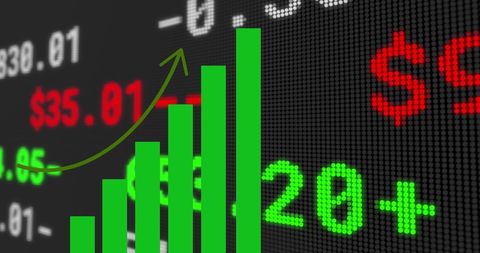
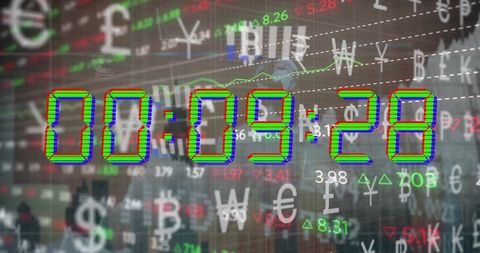
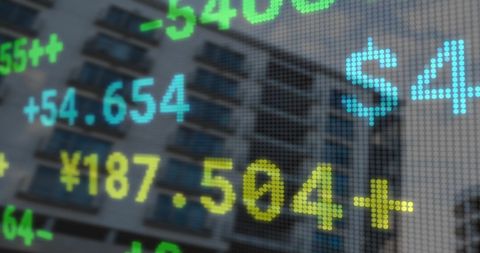
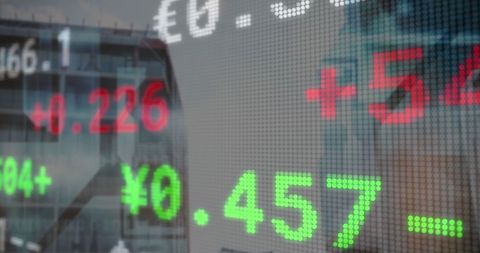
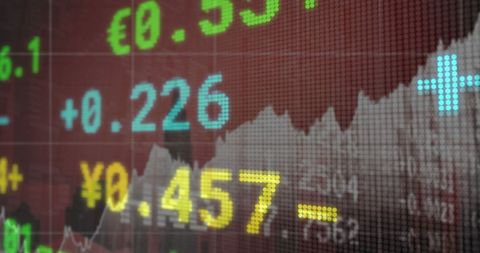
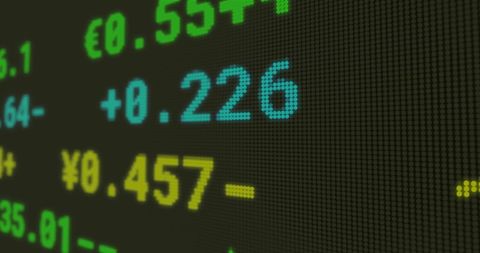
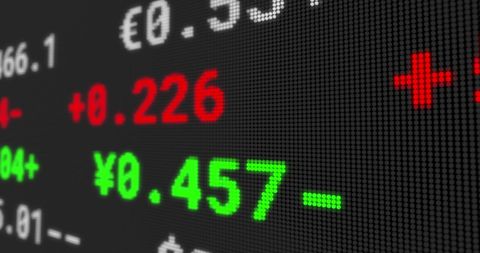
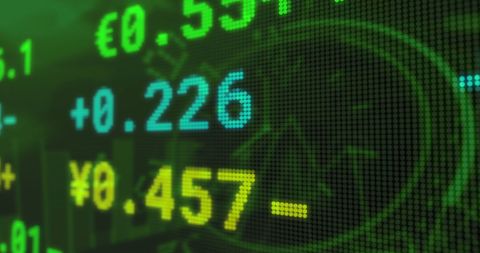
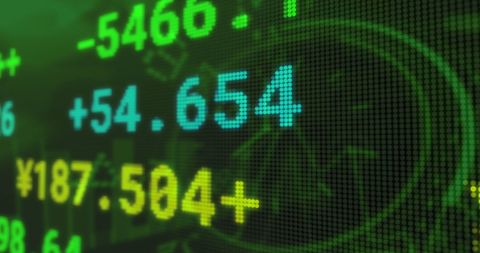
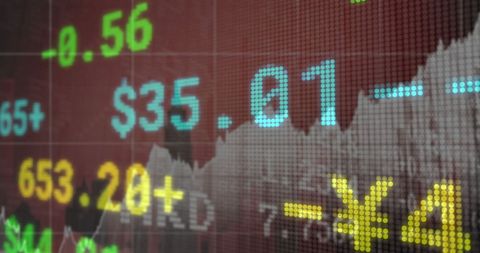
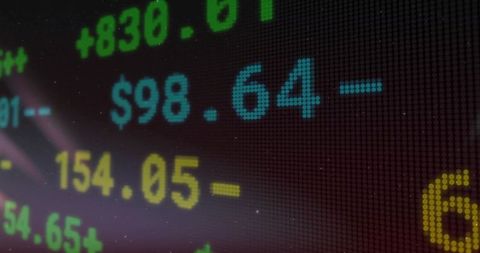
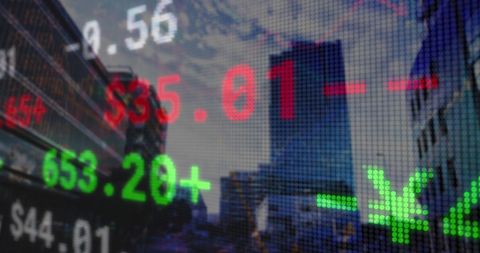
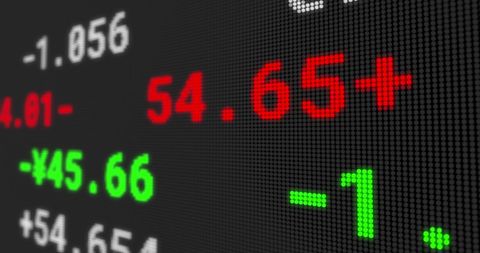
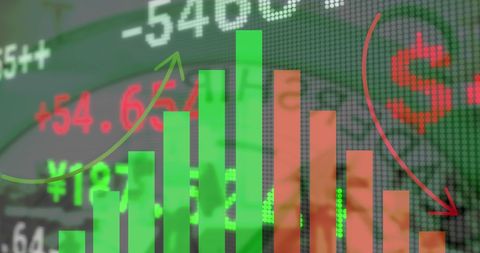
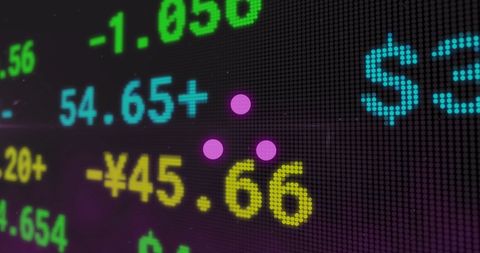
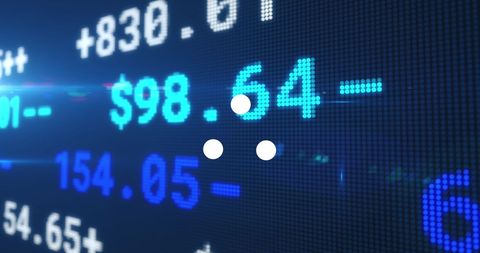
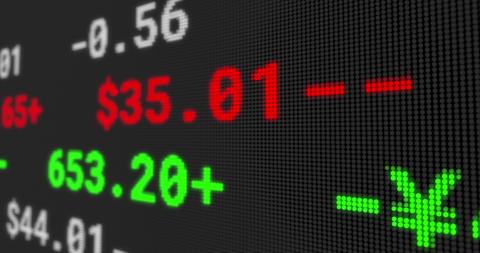
- Financial Data Analysis with Growing Chart and Time Icons
Financial Data Analysis with Growing Chart and Time Icons Image
Depicts conceptual elements of financial growth using vibrant green bars juxtaposed against a backdrop of red numeric displays, symbolizing dynamic stock market activity. Ideal for presentations or publications discussing stock trends, economic forecasts, or investment strategies. This vibrant visual can enhance business reports, data metrics publications, and finance-related websites to convey themes of growth and economic health.

downloads
Tags:
More
Credit Photo
If you would like to credit the Photo, here are some ways you can do so
Text Link
photo Link
<span class="text-link">
<span>
<a target="_blank" href=https://pikwizard.com/photo/financial-data-analysis-with-growing-chart-and-time-icons/54310a2ee76edf2f44a5ea664ba8116a/>PikWizard</a>
</span>
</span>
<span class="image-link">
<span
style="margin: 0 0 20px 0; display: inline-block; vertical-align: middle; width: 100%;"
>
<a
target="_blank"
href="https://pikwizard.com/photo/financial-data-analysis-with-growing-chart-and-time-icons/54310a2ee76edf2f44a5ea664ba8116a/"
style="text-decoration: none; font-size: 10px; margin: 0;"
>
<img src="https://pikwizard.com/pw/medium/54310a2ee76edf2f44a5ea664ba8116a.jpg" style="margin: 0; width: 100%;" alt="" />
<p style="font-size: 12px; margin: 0;">PikWizard</p>
</a>
</span>
</span>
Free (free of charge)
Free for personal and commercial use.
Author: Authentic Images