- Home >
- Stock Photos >
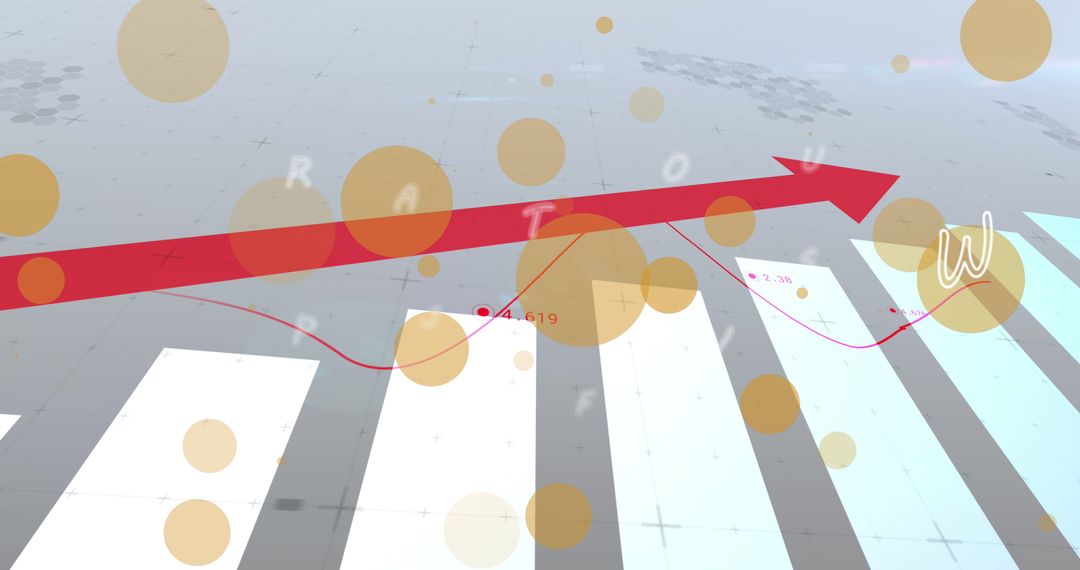
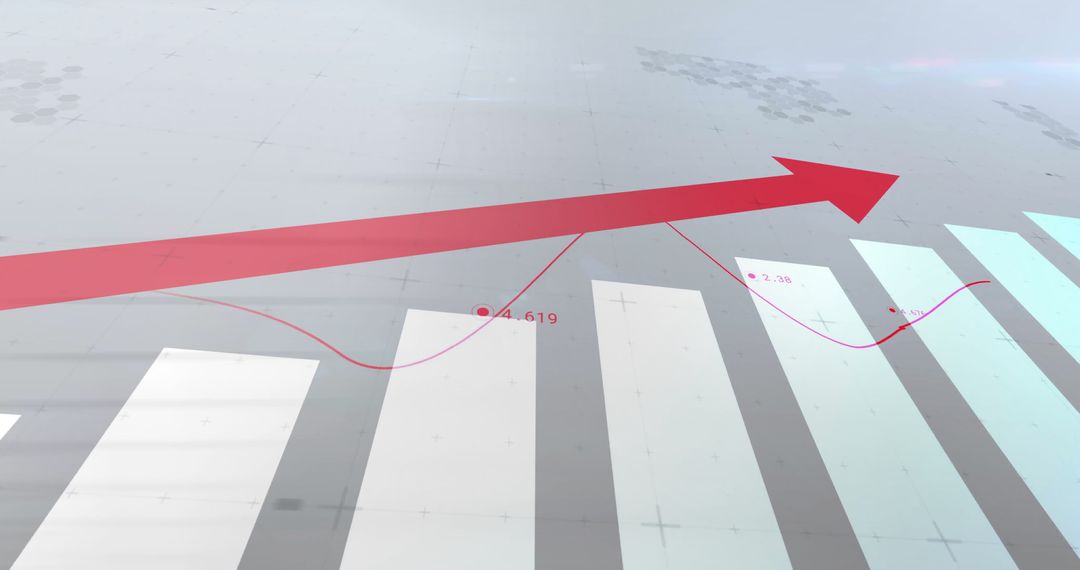
- Financial Data Analysis with Growth Arrow and Statistics
Financial Data Analysis with Growth Arrow and Statistics Image

Illustrates financial data processing with an arrow indicating growth and key statistics, representing concepts of global business development. Useful for presentations on finance, economic forecasts, data analysis in business contexts, and articles on market trends.
Powered by  - Get 15% off with code: PIKWIZARD15


0
downloads
downloads
Tags:
More
Credit Photo
If you would like to credit the Photo, here are some ways you can do so
Text Link
photo Link
<span class="text-link">
<span>
<a target="_blank" href=https://pikwizard.com/photo/financial-data-analysis-with-growth-arrow-and-statistics/40064d4b7d5537084b2de2ae0c506b8b/>PikWizard</a>
</span>
</span>
<span class="image-link">
<span
style="margin: 0 0 20px 0; display: inline-block; vertical-align: middle; width: 100%;"
>
<a
target="_blank"
href="https://pikwizard.com/photo/financial-data-analysis-with-growth-arrow-and-statistics/40064d4b7d5537084b2de2ae0c506b8b/"
style="text-decoration: none; font-size: 10px; margin: 0;"
>
<img src="https://pikwizard.com/pw/medium/40064d4b7d5537084b2de2ae0c506b8b.jpg" style="margin: 0; width: 100%;" alt="" />
<p style="font-size: 12px; margin: 0;">PikWizard</p>
</a>
</span>
</span>
Free (free of charge)
Free for personal and commercial use.
Author: Creative Art
Similar Free Stock Images

Premium


Premium


Premium


Premium


Premium


Premium


Premium


Premium


Premium


Premium


Premium


Premium


Premium


Premium


Premium


Premium


Premium


Premium


Premium


Premium


Premium


Premium


Premium


Premium