
- Home >
- Stock Photos >
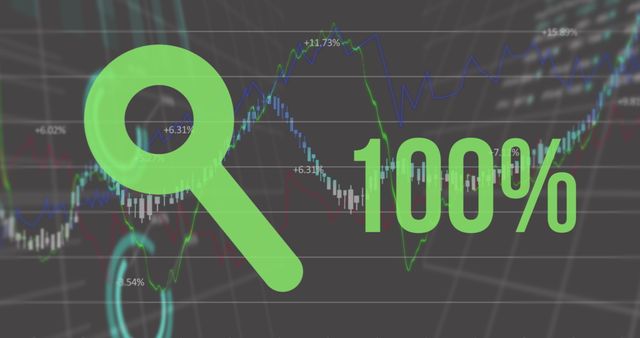
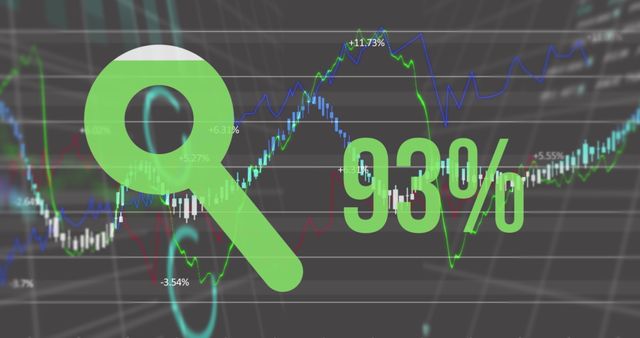
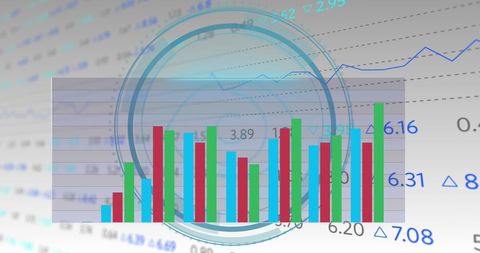
- Financial Data Analysis with Growth Exploration Graphics
Financial Data Analysis with Growth Exploration Graphics Image
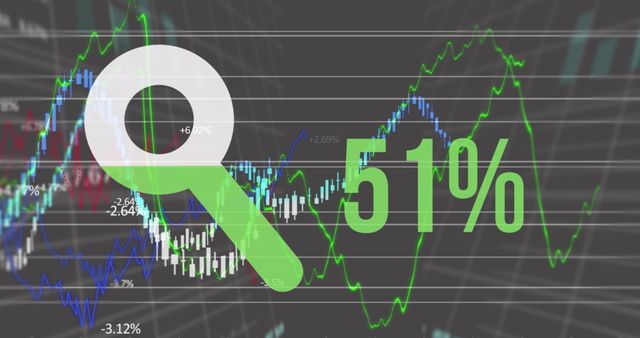
Featuring a blend of financial charts and analytics with a prominently displayed percentage sign and a magnifying glass symbolizing focused growth analysis. Ideal for illustrating concepts in finance, economics, data science, and market research. Useful for business presentations, financial reports, websites focused on economic trends, or educational materials.
Powered by 


downloads
Tags:
More
Credit Photo
If you would like to credit the Photo, here are some ways you can do so
Text Link
photo Link
<span class="text-link">
<span>
<a target="_blank" href=https://pikwizard.com/photo/financial-data-analysis-with-growth-exploration-graphics/842a533c011dd9cd7facfd1dccdb0acf/>PikWizard</a>
</span>
</span>
<span class="image-link">
<span
style="margin: 0 0 20px 0; display: inline-block; vertical-align: middle; width: 100%;"
>
<a
target="_blank"
href="https://pikwizard.com/photo/financial-data-analysis-with-growth-exploration-graphics/842a533c011dd9cd7facfd1dccdb0acf/"
style="text-decoration: none; font-size: 10px; margin: 0;"
>
<img src="https://pikwizard.com/pw/medium/842a533c011dd9cd7facfd1dccdb0acf.jpg" style="margin: 0; width: 100%;" alt="" />
<p style="font-size: 12px; margin: 0;">PikWizard</p>
</a>
</span>
</span>
Free (free of charge)
Free for personal and commercial use.
Author: Awesome Content
Similar Free Stock Images
Premium


Premium

Premium


Premium


Premium


Premium

Premium


Premium


Premium


Premium

Premium


Premium


Premium


Premium

Premium


Premium


Premium


Premium


Premium


Premium

Premium

Premium


Premium


Premium
Premium


Explore More Free Stock Images