1. Home > 
  2. Stock Photos > 
  3. Financial Data Analysis with Growth Indication

Financial Data Analysis with Growth Indication Image

Financial Data Analysis with Growth Indication

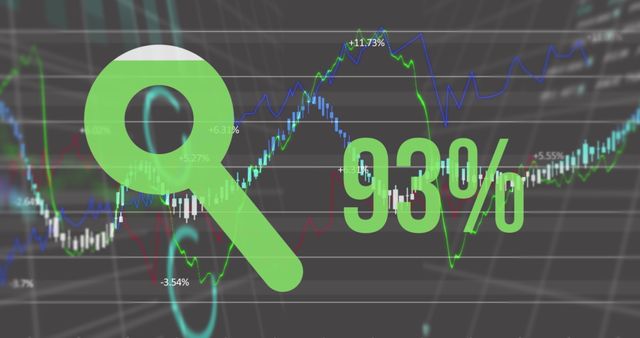
Visual representation of financial data with a focus on percentage growth trends, underlined by colorful digital graphs. Useful for web content relating to economic trends, business presentations, and financial reports aimed at illustrating financial analytics or portraying success in business growth.

Powered by Shutterstock logo - Get 15% off with code: PIKWIZARD15
Futuristic stock market chart with upward arrows, glowing financial interface style, on dark gradient background. Concept of business growth and strategy - Powered by Shutterstock - Get 15% off with code: PIKWIZARD15A weekly business performance report and analytics dashboard. A concept for tracking trends, KPIs, financial data, and insights over time. Motif - Powered by Shutterstock - Get 15% off with code: PIKWIZARD15Person analyzing financial growth bar chart on laptop and tablet screen. Concept of business performance, success, data analytics, and digital marketing strategy in modern economy. - Powered by Shutterstock - Get 15% off with code: PIKWIZARD15Businessman analyzing virtual graph chart on laptop screen. Concept of data analysis, financial growth, performance tracking, digital technology, and business intelligence. - Powered by Shutterstock - Get 15% off with code: PIKWIZARD15concept of artificial intelligence and data analysis, businessman demonstrates virtual interface of graph and holographic AI brain on hand, conveying future technology and intelligent work assistant. - Powered by Shutterstock - Get 15% off with code: PIKWIZARD15

Credit Photo

If you would like to credit the Photo, here are some ways you can do so

Free (free of charge)

Free for personal and commercial use.

Author: Awesome Content

Similar Free Stock Images

Dynamic Financial Data Analytics and Stock Market Trends
Premium
Business data analysis dashboard showing charts, statistics, and performance metrics for decision-making, revenue tracking, and strategic planning in organizations Latch
5G Technology Overlays Financial Data in Digital Concept
Financial Data Analysis on Digital Display
Premium
Businessman analyzing digital dashboard with futuristic charts and diagrams on transparent virtual screen, concept of data analysis
Financial Analysis Charts Data With Global Business Stats
Futuristic Global Financial Data Analysis Background
Dynamic Digital Dashboard with Sustainable Energy Indicators
Premium
KPI data analytics concept, Key performance indicator analysis system. Information technology digital software management. Visualization tech solution. Business artificial intelligence. AI dashboard.
Premium
esg, sustainability, energy, renewable, eco, environment, A hand uses a digital pen on a tablet with glowing ESG charts, symbolizing sustainability analysis and green investment.
Digital Interface Code with Dynamic Business Chart Graphics
Dynamic Financial Data Visualization with Moving Numbers
Innovative Digital Finance Data Display on Dark Interface
Dynamic Financial Graphs Illustrating Business Growth
Premium
Analysis finance grow graph and market investment. Financial business plan,earnings,sale and strategy. Stock market chart, exchange financial growth diagram.
Global Networking and Data Visualization Over Stormy Sky
Digital Stock Market with Cloud Icons over City Skyline at Night
Financial Data Analysis with Growth Exploration Graphics
Digital Data Analytics Growth Trend with Graphs
Premium
Financial chart and investment graph analysis stock on tablet screen. Data dashboard and report insight for finance growth, stock market, and business performance strategy.
Futuristic Stock Market Concept with Social Media Integration
Stock Market Graph with Fluctuations and Financial Data
Financial Data Overlay with Server Room Background
Financial Data Analysis Over Vibrant Cityscape Background
Digital Dashboard Showing Financial Analysis with Graphs
Dynamic Financial Data Analysis Illustration
Global Currency Symbols and Financial Network Graph
Dynamic Financial Graphs and Data Fluctuations
Dynamic Stock Market Graphs and Tickers Displaying Performance
Financial Data Visualization with Increasing Graph Trend
Futuristic Financial Charts with Virtual Arrows
Dynamic Stock Market Graphs Showing Fluctuating Trends
Digital Financial Data with Graphs and Numbers Illustrations
Digital Clock Overlay on Abstract Data Flow Background
Balance Between Time and Wealth with Data Graphs
Dynamic Stock Market Analysis with Blue Graphs and Percentages
Green Financial Data Line Graph Over Cityscape Background
Premium
Digital Compliance Quality concept with a businessman holding glowing virtual chart in his palm, showing rising financial data, analytics icons, and investment growth for corporate success.
Financial Graphs Overlaying Cityscape Illustrate Global Economy
Red Economy Chart Displays Market Downturn Digital Background
Rising Green Line on Financial Digital Display
Digital Financial Analytics Merging with Chemical Data
Global Data Processing Interface Concept with Earth
Glowing Stock Market Financial Chart Data Overlay
Premium
Conceptual visual of data analysis with black woman working in the office
Digital Financial Graph with Rising Line Trend on Dark Background
Dynamic Financial Data Display with Global Networking Theme
Dynamic Stock Market Data and Cityscape Background
Digital Finance and Data Visualization Concept with Growing Chart
Premium
Financial chart with forex and stock market data, abstract graphic style, over a blurred office background, concept of business investment analysis
Global Financial Data Processing with Digital Interface Elements
NFT Text Overlay Financial Stock Data on Dark Background
Abstract Data Analysis Over Digital Interface
Digital Stock Market Data Over Cityscape Concept
Premium
Data analytics and big data strategy for real-time analytics, predictive data modeling, business intelligence analytics, and data-driven decision-making in modern digital businesses. Spline
Premium
Dashboard finance management on laptop computer analyzing sales data and growth graph chart report. Business planning, strategy and development. Financial accounting. market research, data analysis
Premium
Finance, laptop and team of business people planning, meeting and profit growth discussion. Data, group and brainstorming in office, training and operations manager coaching with metrics or analysis
Virtual Data Analysis with Graphs and User Icons
Stock Market Trends and Data Analysis over Digital Grid
Abstract Digital Finance Graph Interface Display
Premium
Data Analytics concept, Data Annotation, Data Analysis, Businessman use laptop analyzing data to track customer loyalty programs and retention strategies
Premium
Sales data analysis dashboard showing performance, trends, and insights. Sales data tracks growth, supports decisions, sales data boosts strategy, and sales data drives performance. Latch
Dynamic Financial Growth Chart on Digital Screen
Futuristic Financial Graphs with Dynamic Green Line
Premium
Data analytics dashboard with charts, indicators, and performance metrics, reveals trends, data analytics drives growth, supports insight, and data analytics improves decisions. Vouch
Premium
Meeting, colleagues and discussion with paperwork in boardroom, data analysis and financial growth. Office, business analyst and people with report for performance, conversation and collaboration
Stock Market Graph and Data Analysis
Global Financial Market Trends on Digital Screen
Dynamic Financial Data Charts and Digital Interface Concepts
Premium
Sales data analysis dashboard showing performance, trends, and insights. Sales data tracks growth, supports decisions, sales data boosts strategy, and sales data drives performance. Vouch
Global Finance and Economy Interface with Digital Graphs
Green Line Graph Overlaid on Empty Office with Data Overlay
Digital Financial Data with Trending Arrows
Premium
Futuristic Digital Growth Chart – 3D Bar Graph with Glowing Blue Data Visualization
Dynamic Stock Market Graphs and Financial Data Visualization
Financial Datasets with Growth Indicators and Search Symbols
Digital Security Interface with Biometrics and Encryption Symbol
Financial Data Analysis with Stock Market Graphs
Digital Financial Data Visualization on Grid Display
Premium
Business Growth 2026 Forecast, Businessman Using AI Technology and Data Analytics for Market Analysis, Workflow, Economic Strategy, Corporate Goal Setting, Digital Transformation,Strategic Development
Illuminated Financial Data Chart Display on Dark Backdrop
Dynamic Financial Data Trends with Fluctuating Graphs and Charts
Security Hologram Over Digital Stock Market Analysis
Futuristic Digital Financial Analysis with City Background
Premium
Growth graph a year 2026 of business and data analysis. Development to success in year 2026.
Holographic Battery Icon Over Stock Market Trading Board
Abstract Financial Data with Digitally Enhanced Graphs
Bitcoin Symbol on Digital Financial Data Background
Stock Market Data Analysis with Digital Security Element
Premium
Woman holding a paper with esg cycle diagram while discussing environment, social, governance issues
5G Technology Concept with Data and Analytics Background
Futuristic Financial Data Visualization Over City
Data Processing with Virtual Grid and Cloud Imagery
Financial Data Market Chart Analysis with Digital Overlay
Stock Market Decline Data Analysis on Dark Grid Background
Dynamic Global Financial Analytics with Rising Graph Visualization
Global Financial Data Visualization and Analysis
Abstract Pink Bar Graph Over Digital Grid Background
Stock Market Graph Reflecting Financial Trends and Analysis
Red Line Graph Overlaying Office Computers Symbolizing Data Analysis
Dynamic Financial Data Graph Visualization on Black Background
Rising Financial Graphs with Digital Data Interface
Futuristic Financial Data Dashboard with Circular Interface
Data Analytics with Graph and Code Overlay on White Background
Digital Financial Graph Over Cityscape at Dusk
Premium
Business data analytics and intelligence dashboard concept, businessman using futuristic holographic graphs and charts on laptop, big data analysis, KPIs, statistics, digital transformation.
5G Technology Concept with Financial Data Visualization
Financial Data Analysis with Graphs and Symbols
Dynamic Financial Data Overlaying Urban Cityscape
Premium
A diverse business team engages in collaborative data analysis using charts and graphs displayed on a tablet, surrounded by reports in a modern office setting. SACTR
Abstract Data Chart with Graphical Patterns
Complex Financial Graphs Showing Market Changes and Data Analysis
Digital Interface with Sale Graphics and Data Patterns
Financial Data Information with Graphs and Charts for Stock Market Analysis
Premium
Business data analysis dashboard showing charts, statistics, and performance metrics for decision-making, revenue tracking, and strategic planning in organizations Vouch
Dynamic Data Visualization with Virtual Graphs and Numbers
Data Projection Over Cityscape Indicating Digital Economy
Dynamic Stock Market Graphs with Finance Data
Futuristic Financial Data Interface and Analysis Display
Digital Financial Graph Interface on Car Dashboard over Industry Trends
Abstract Financial Data Display with Analytical Graphs
Digital Data Analysis with Network Connections on a Grid Background
Premium
investor or developer digital stylus with virtual graph real estate data. market analysis and financial planning for successful property investment.
Dynamic Financial Data Visualization on Grid
Dynamic Stock Market Ticker and Graph Analysis
Explore More Free Stock Images