- Home >
- Stock Photos >
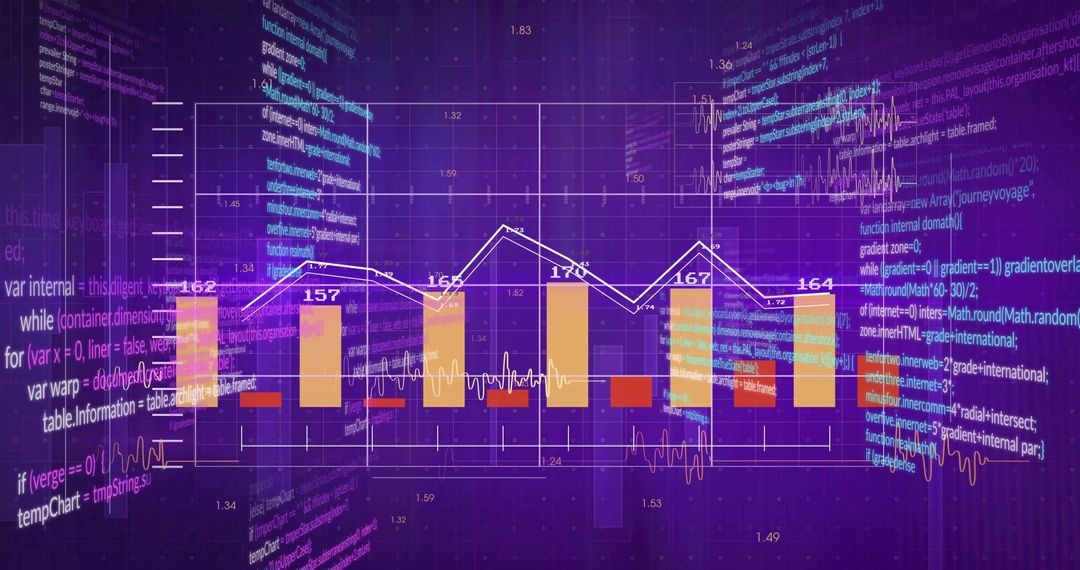
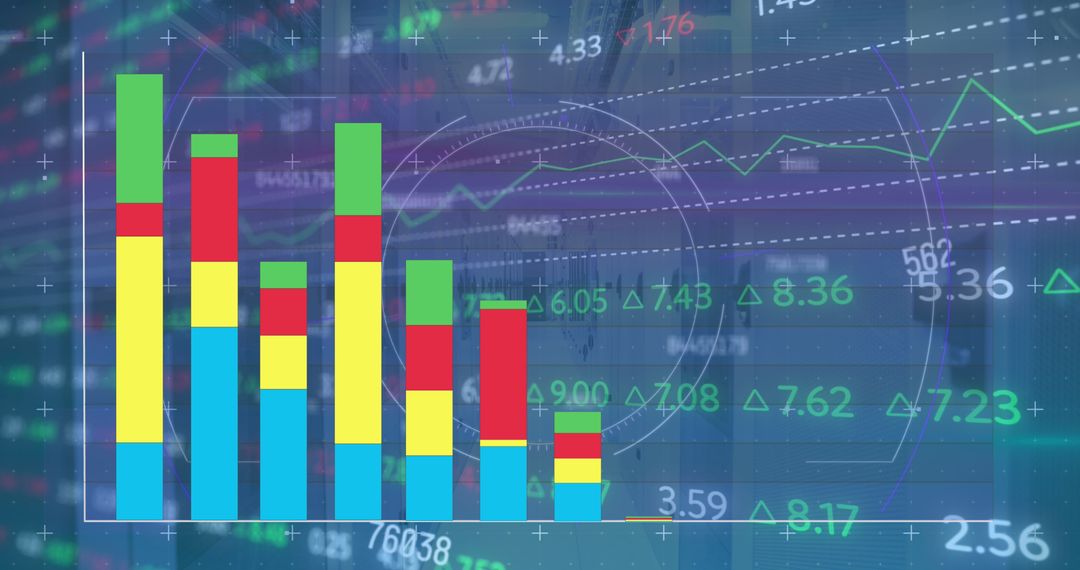
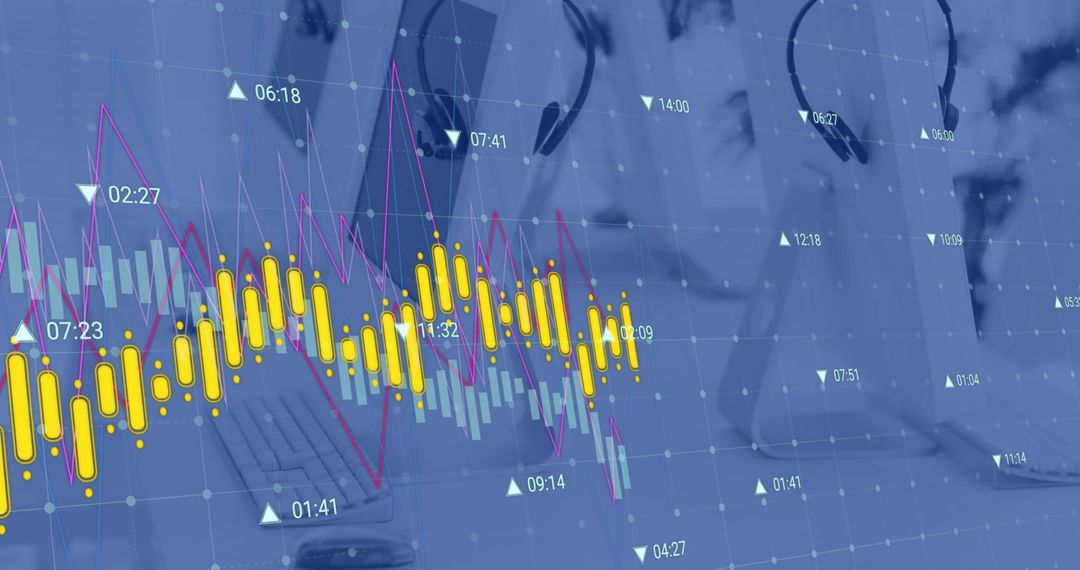
- Financial Data Analysis with Stock Market Trends and Graphs
Financial Data Analysis with Stock Market Trends and Graphs Image

Image shows digital graphs and text depicting financial analytics on a purple background, projecting stock, sales, costs, profits, debt, currency information, creating a futuristic and dynamic representation of technology's role in modern finance. Great for use in financial technology briefs, business presentations, economic research articles, or business intelligence software showcases.
Powered by  - Get 15% off with code: PIKWIZARD15


2
downloads
downloads
Tags:
More
Credit Photo
If you would like to credit the Photo, here are some ways you can do so
Text Link
photo Link
<span class="text-link">
<span>
<a target="_blank" href=https://pikwizard.com/photo/financial-data-analysis-with-stock-market-trends-and-graphs/1179cf02f159fcf1ecae56b4e2d39ae8/>PikWizard</a>
</span>
</span>
<span class="image-link">
<span
style="margin: 0 0 20px 0; display: inline-block; vertical-align: middle; width: 100%;"
>
<a
target="_blank"
href="https://pikwizard.com/photo/financial-data-analysis-with-stock-market-trends-and-graphs/1179cf02f159fcf1ecae56b4e2d39ae8/"
style="text-decoration: none; font-size: 10px; margin: 0;"
>
<img src="https://pikwizard.com/pw/medium/1179cf02f159fcf1ecae56b4e2d39ae8.jpg" style="margin: 0; width: 100%;" alt="" />
<p style="font-size: 12px; margin: 0;">PikWizard</p>
</a>
</span>
</span>
Free (free of charge)
Free for personal and commercial use.
Author: People Creations
Similar Free Stock Images

Premium


Premium


Premium


Premium


Premium


Premium


Premium


Premium


Premium


Premium


Premium


Premium


Premium


Premium


Premium


Premium


Premium


Premium


Premium


Premium


Premium


Premium


Premium


Premium