
- Home >
- Stock Photos >
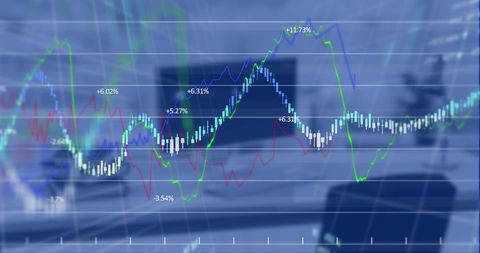
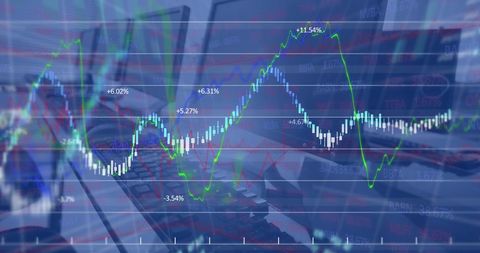
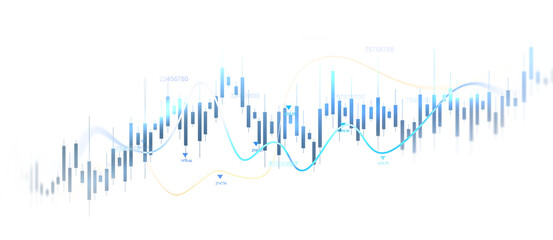
- Financial Data Analysis with Stock Market Trends
Financial Data Analysis with Stock Market Trends Image

Abstract representation of stock market trends and financial analytics. Useful for illustrating concepts in financial technology advantages, investment strategies, and data-driven decision making. Ideal for presentations, business reports, and educational materials on global finance dynamics and the role of technology in modern trading.
Powered by 


downloads
Tags:
More
Credit Photo
If you would like to credit the Photo, here are some ways you can do so
Text Link
photo Link
<span class="text-link">
<span>
<a target="_blank" href=https://pikwizard.com/photo/financial-data-analysis-with-stock-market-trends/b49bbe74b3cefbf762b85059a6263023/>PikWizard</a>
</span>
</span>
<span class="image-link">
<span
style="margin: 0 0 20px 0; display: inline-block; vertical-align: middle; width: 100%;"
>
<a
target="_blank"
href="https://pikwizard.com/photo/financial-data-analysis-with-stock-market-trends/b49bbe74b3cefbf762b85059a6263023/"
style="text-decoration: none; font-size: 10px; margin: 0;"
>
<img src="https://pikwizard.com/pw/medium/b49bbe74b3cefbf762b85059a6263023.jpg" style="margin: 0; width: 100%;" alt="" />
<p style="font-size: 12px; margin: 0;">PikWizard</p>
</a>
</span>
</span>
Free (free of charge)
Free for personal and commercial use.
Author: Creative Art
Similar Free Stock Images
Loading...

Premium


Premium


Premium


Premium


Premium


Premium


Premium


Premium


Premium


Premium


Premium

Premium

Premium


Premium


Premium


Premium


Premium


Premium


Premium

Premium


Premium


Premium

Premium


Premium

Premium
Explore More Free Stock Images