- Home >
- Stock Photos >
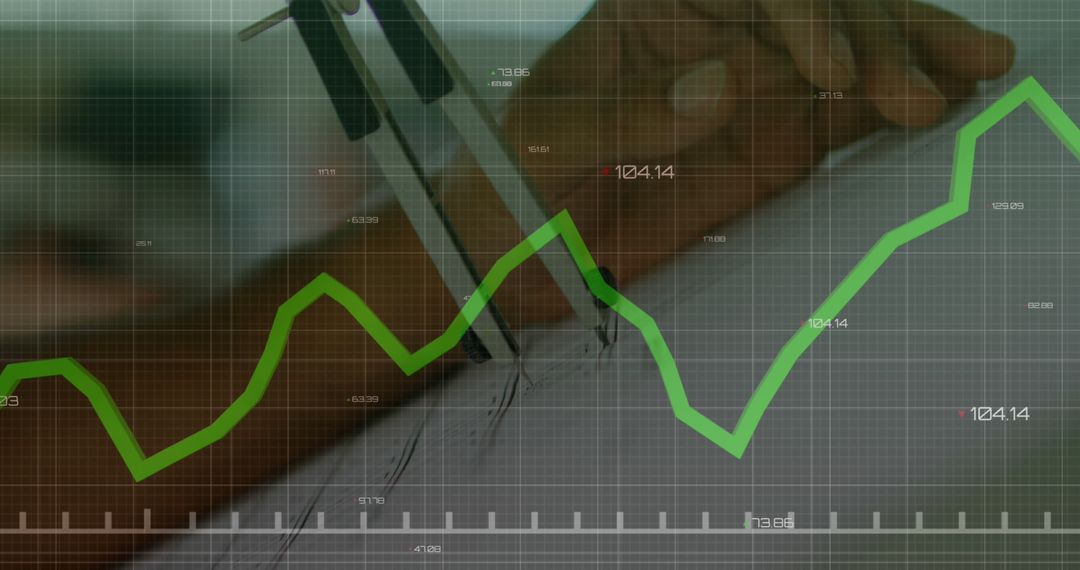
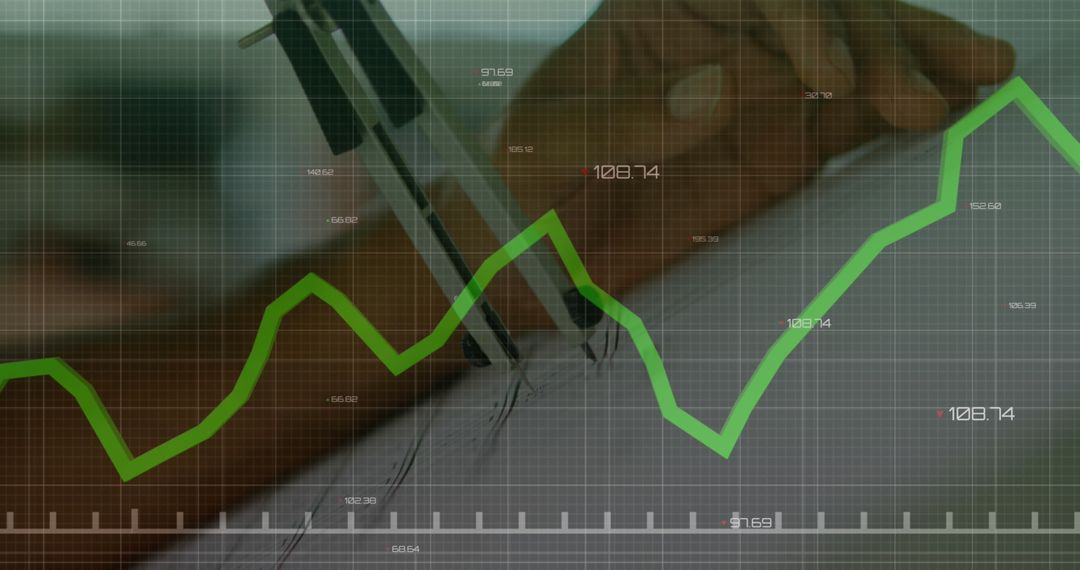
- Financial Data Analysis with Tablet and Growth Chart
Financial Data Analysis with Tablet and Growth Chart Image
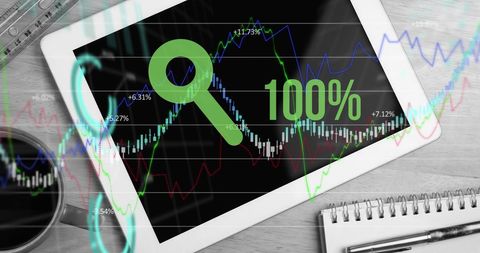
A tablet screen displaying financial data analysis and dynamic growth chart lies on a desk, featuring upward percentage growth figures. This suggests ongoing market success and dynamic financial planning. Useful for content focusing on finance, stock market trends, business growth strategies, and technological advances in financial sectors.
Powered by  - Get 15% off with code: PIKWIZARD15


2
downloads
downloads
Tags:
More
Credit Photo
If you would like to credit the Photo, here are some ways you can do so
Text Link
photo Link
<span class="text-link">
<span>
<a target="_blank" href=https://pikwizard.com/photo/financial-data-analysis-with-tablet-and-growth-chart/f6e27087d2f8cf345e553a2e4431a708/>PikWizard</a>
</span>
</span>
<span class="image-link">
<span
style="margin: 0 0 20px 0; display: inline-block; vertical-align: middle; width: 100%;"
>
<a
target="_blank"
href="https://pikwizard.com/photo/financial-data-analysis-with-tablet-and-growth-chart/f6e27087d2f8cf345e553a2e4431a708/"
style="text-decoration: none; font-size: 10px; margin: 0;"
>
<img src="https://pikwizard.com/pw/medium/f6e27087d2f8cf345e553a2e4431a708.jpg" style="margin: 0; width: 100%;" alt="" />
<p style="font-size: 12px; margin: 0;">PikWizard</p>
</a>
</span>
</span>
Free (free of charge)
Free for personal and commercial use.
Author: Authentic Images
Similar Free Stock Images

Premium


Premium


Premium


Premium


Premium


Premium


Premium


Premium


Premium


Premium


Premium


Premium


Premium


Premium


Premium


Premium


Premium


Premium


Premium


Premium


Premium


Premium


Premium


Premium