- Home >
- Stock Photos >
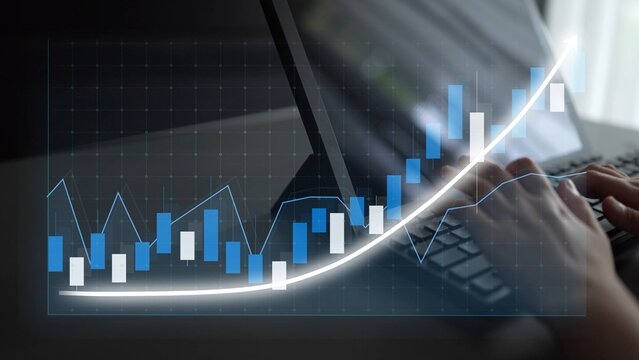
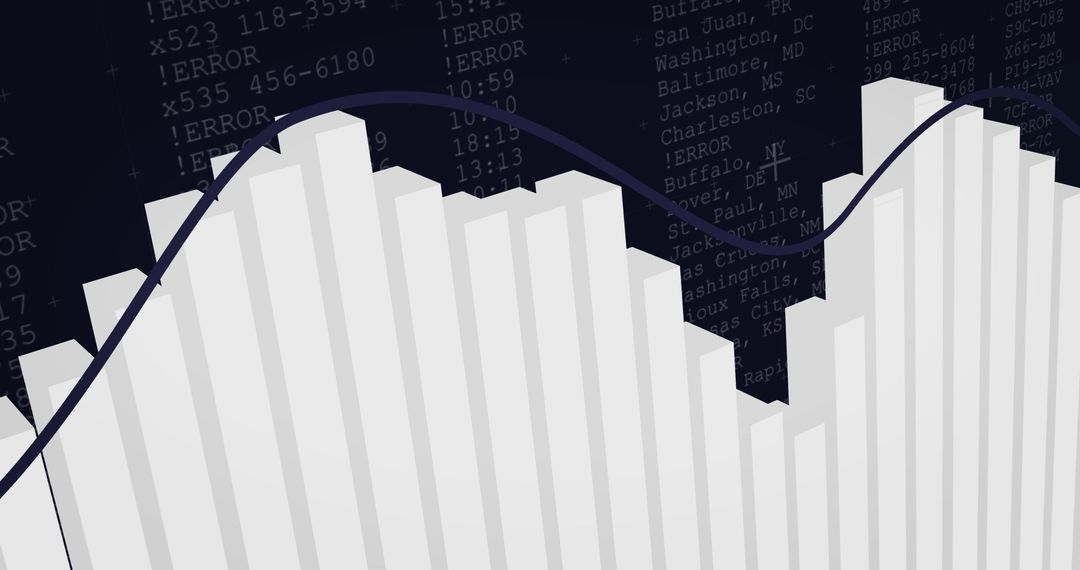
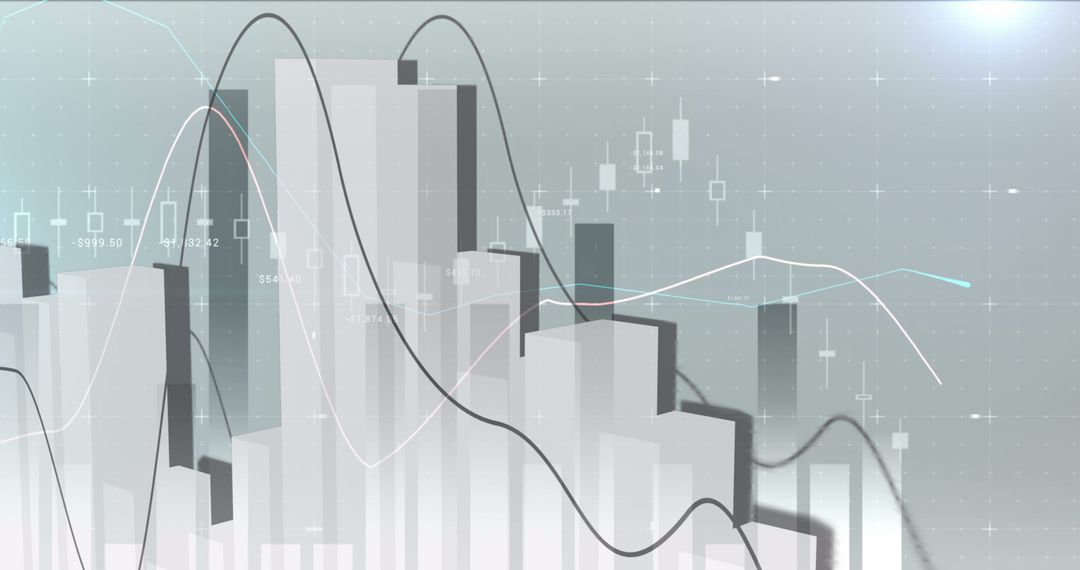
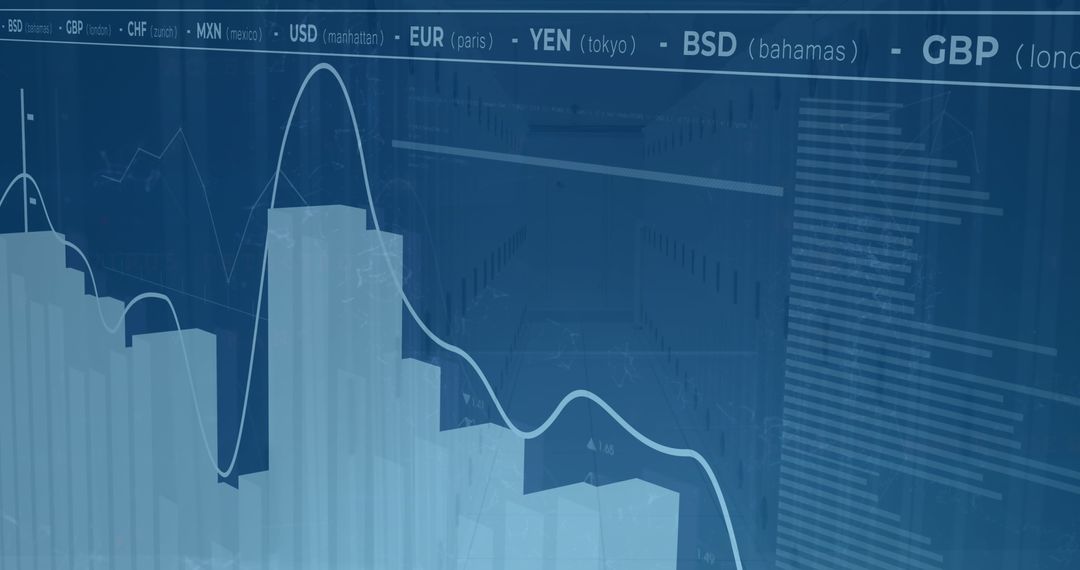
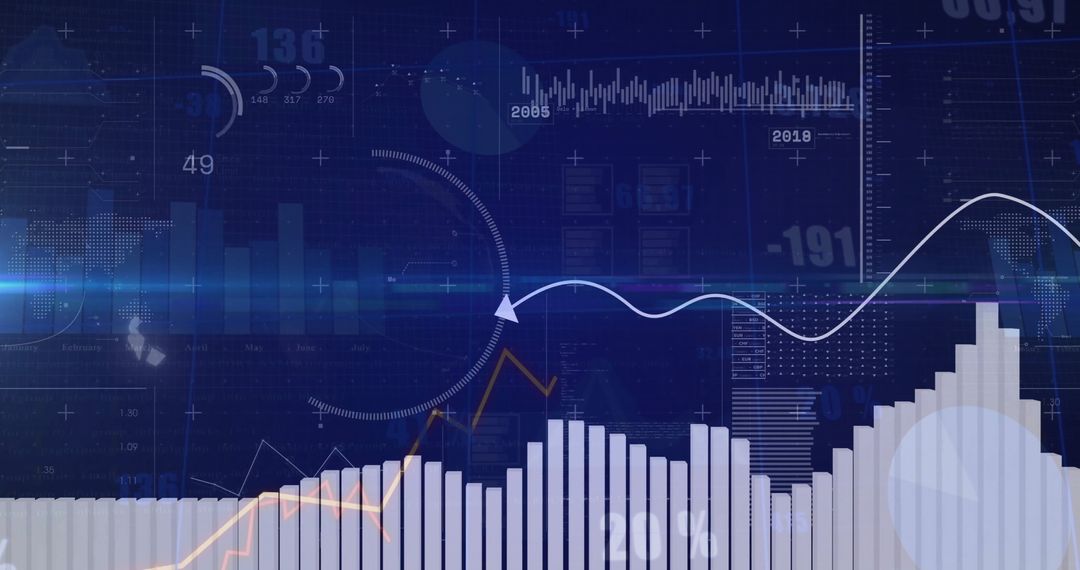
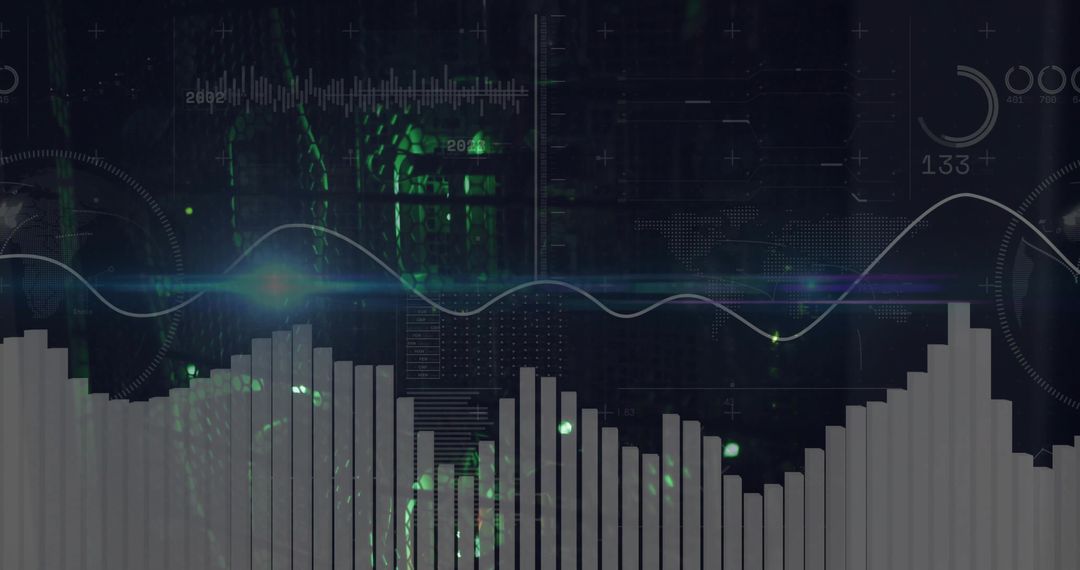
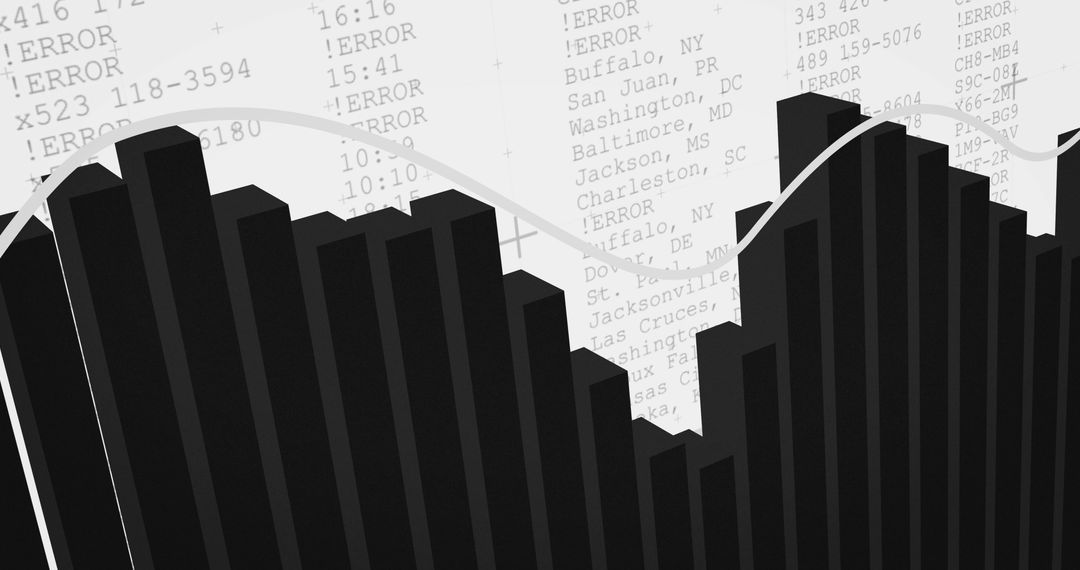
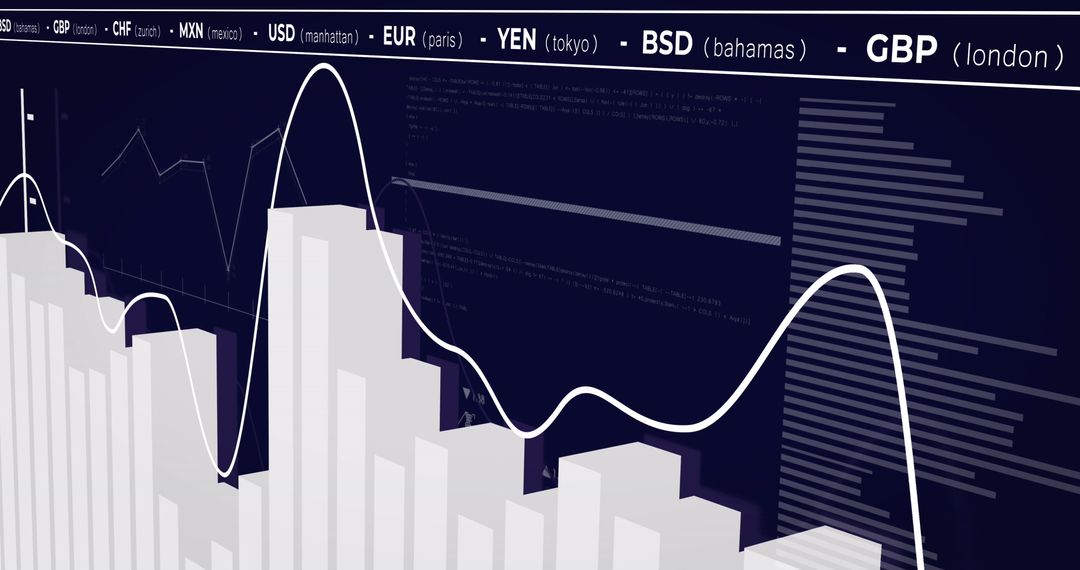
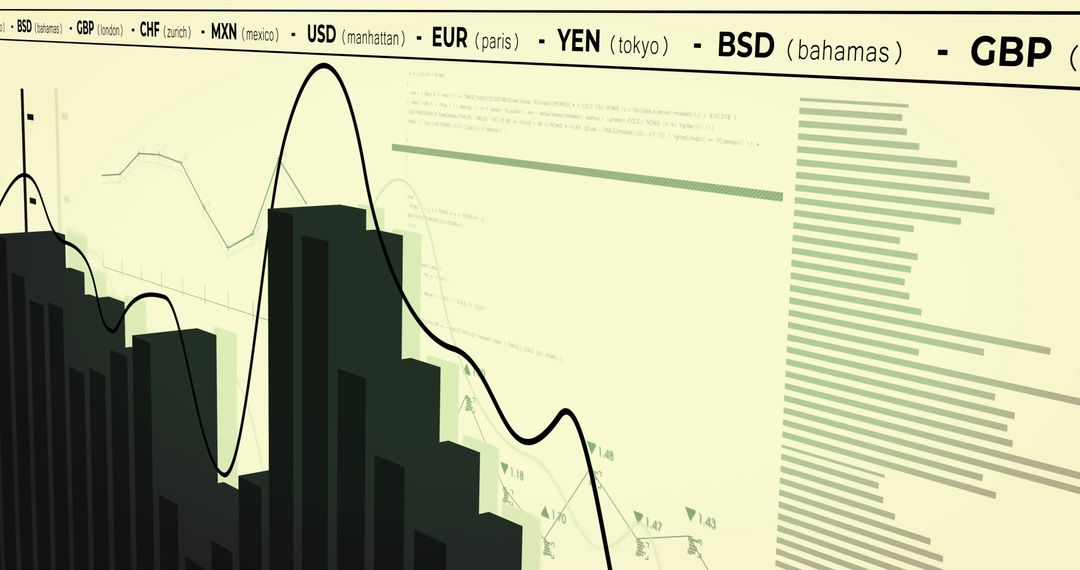
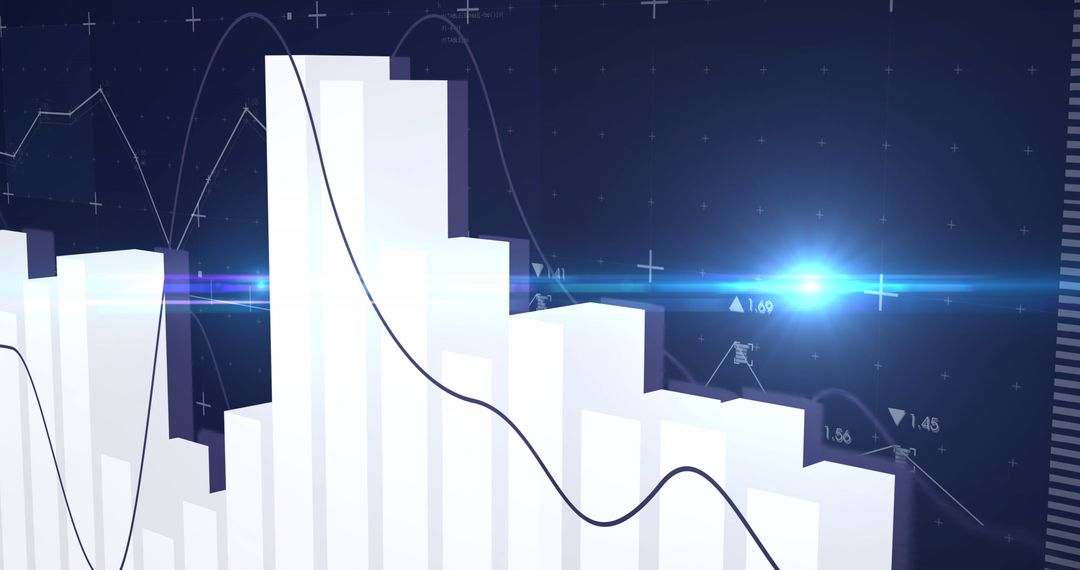
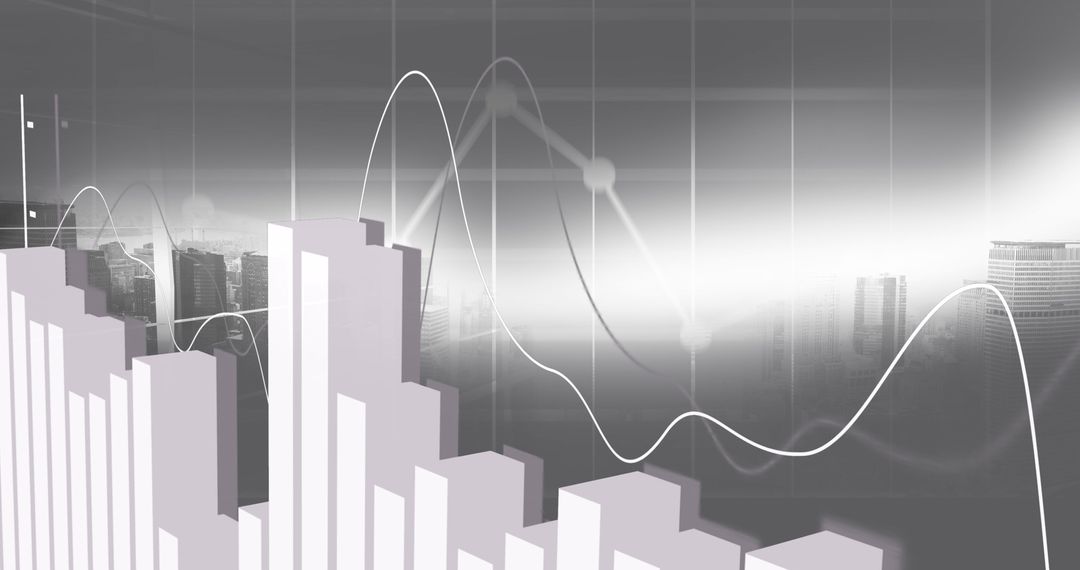
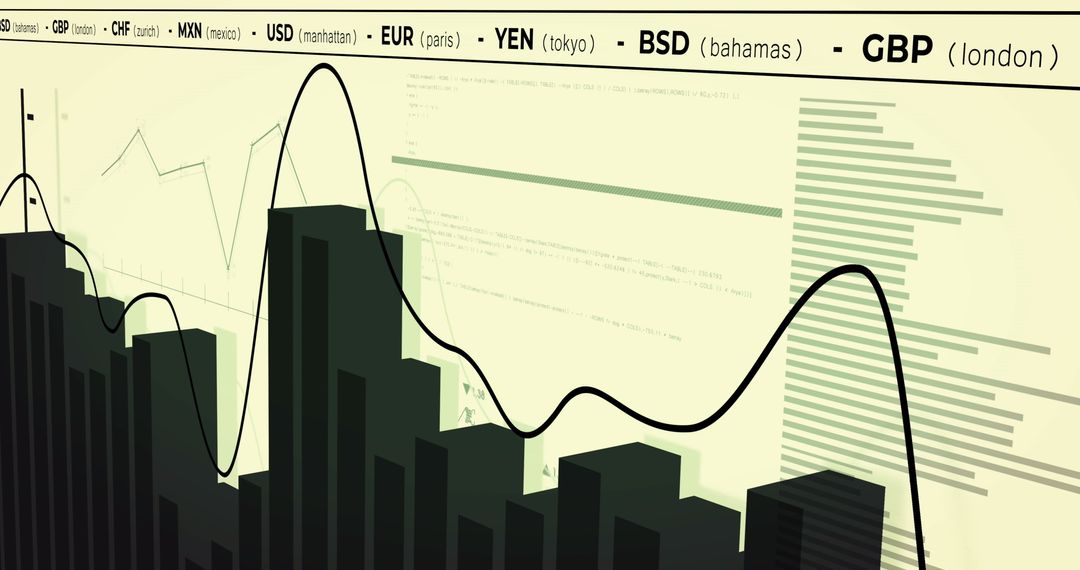
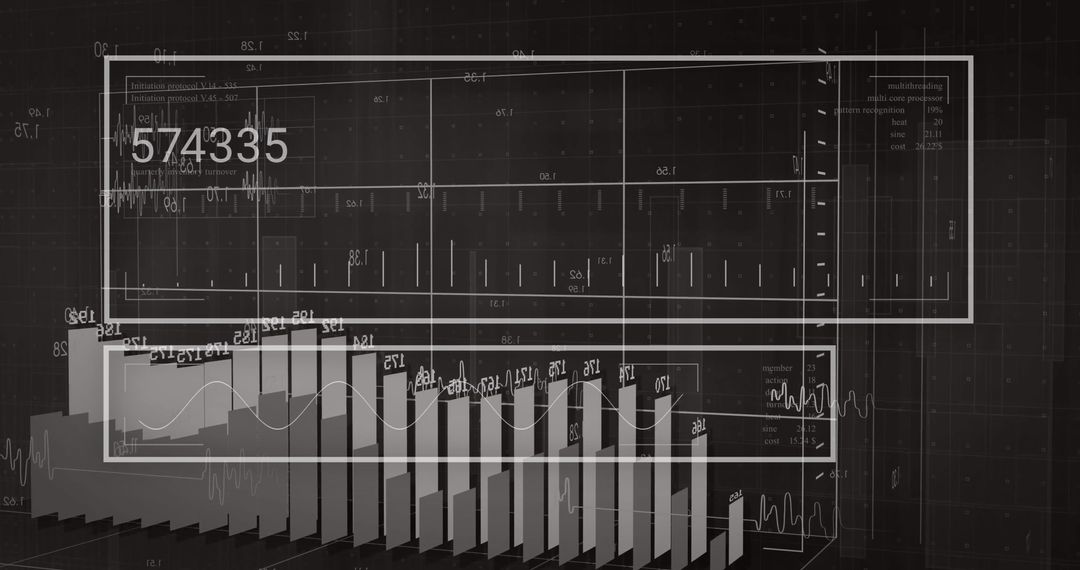
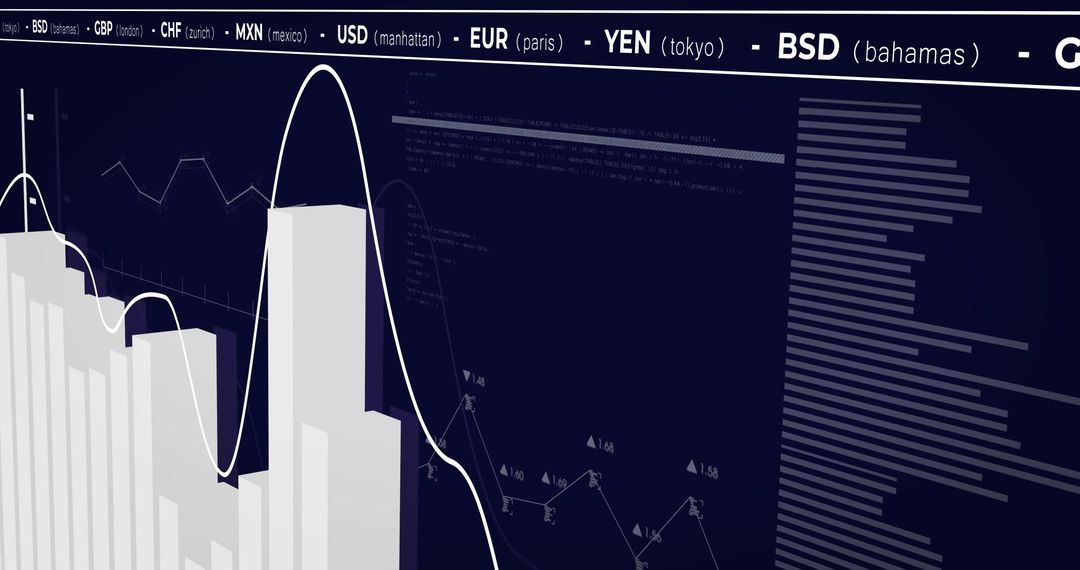
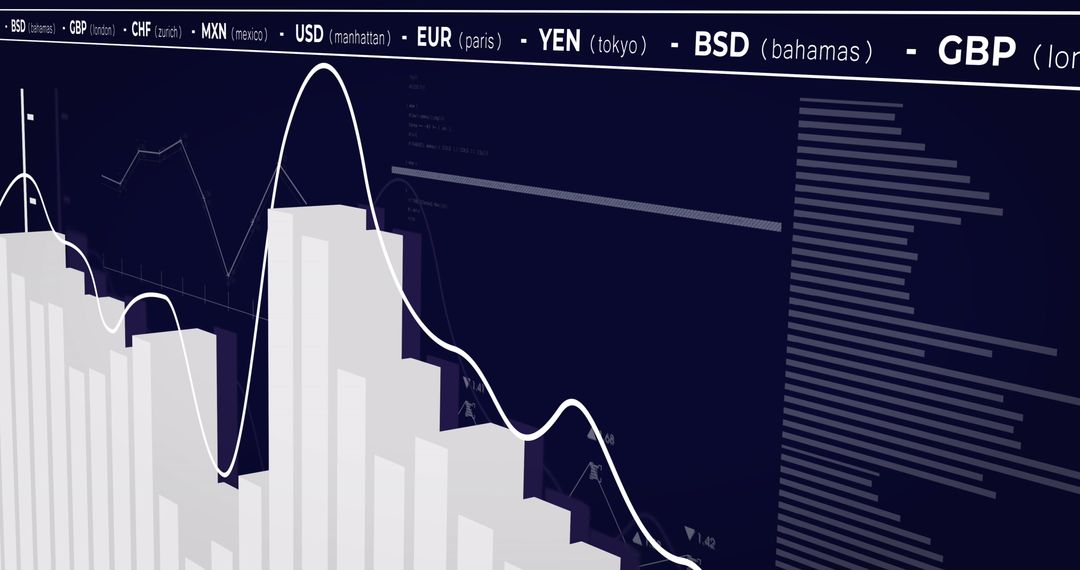
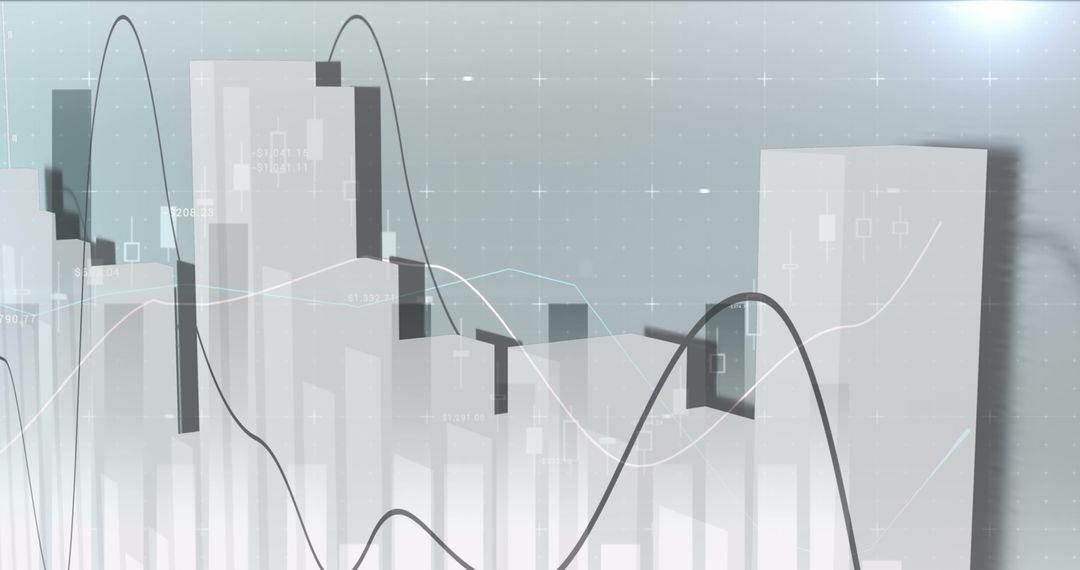
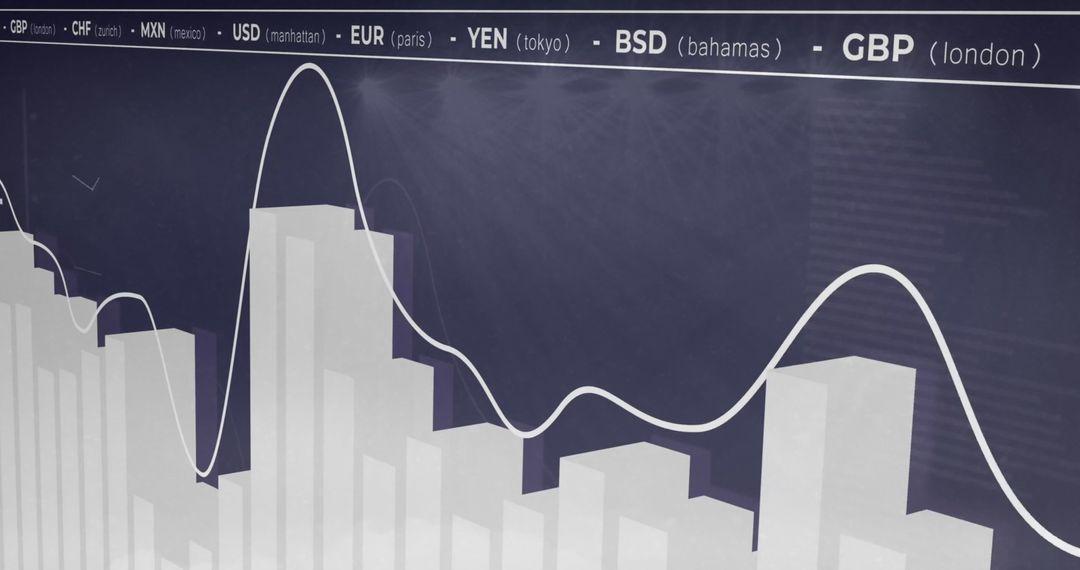
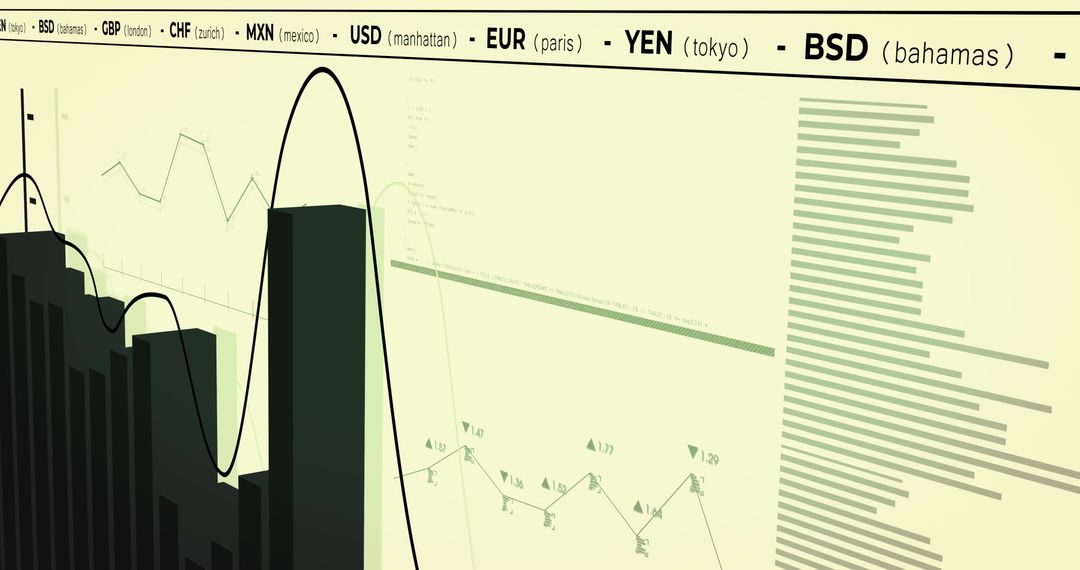
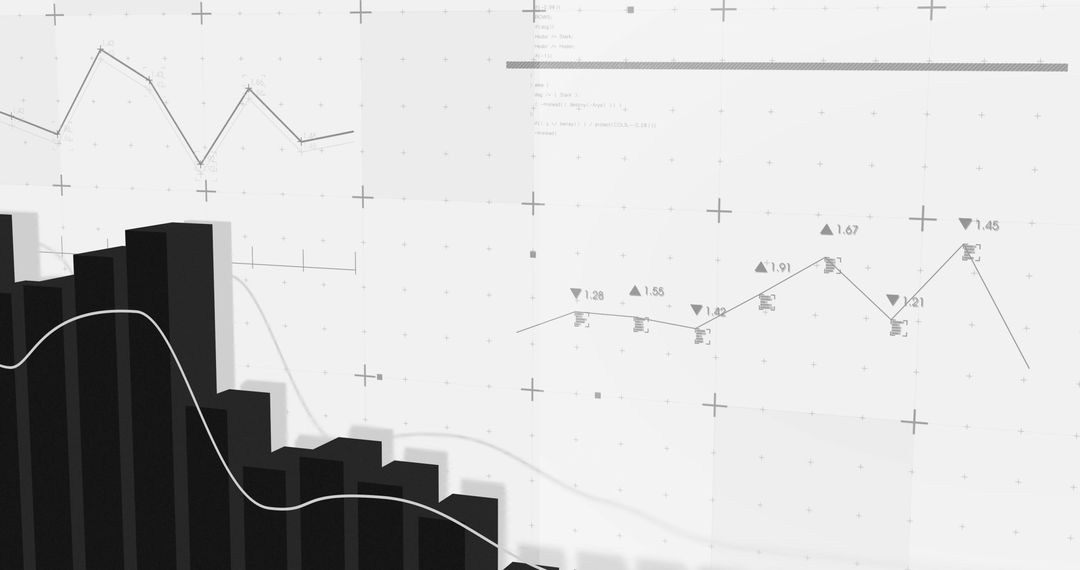
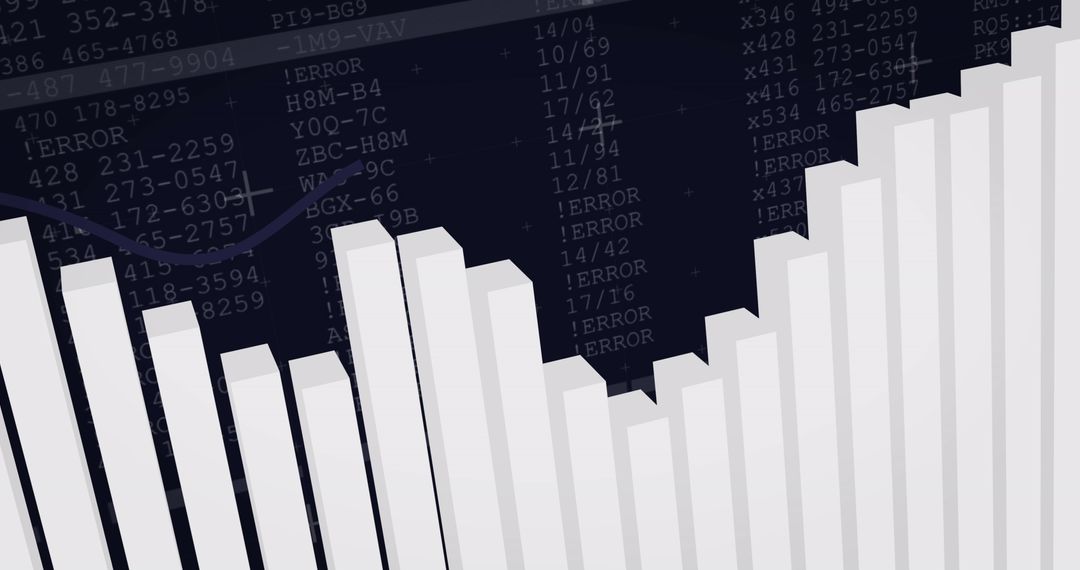
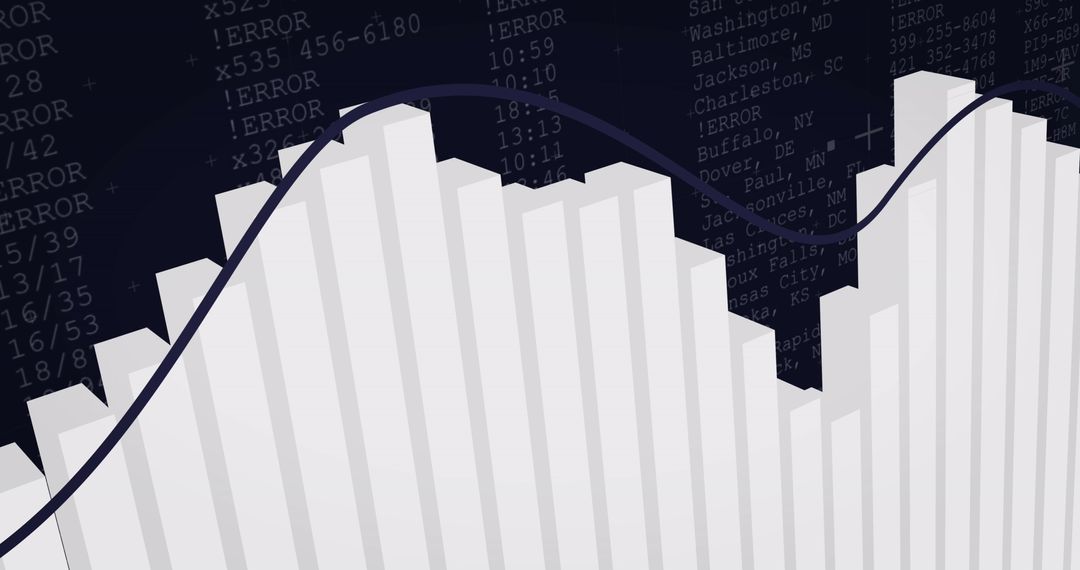
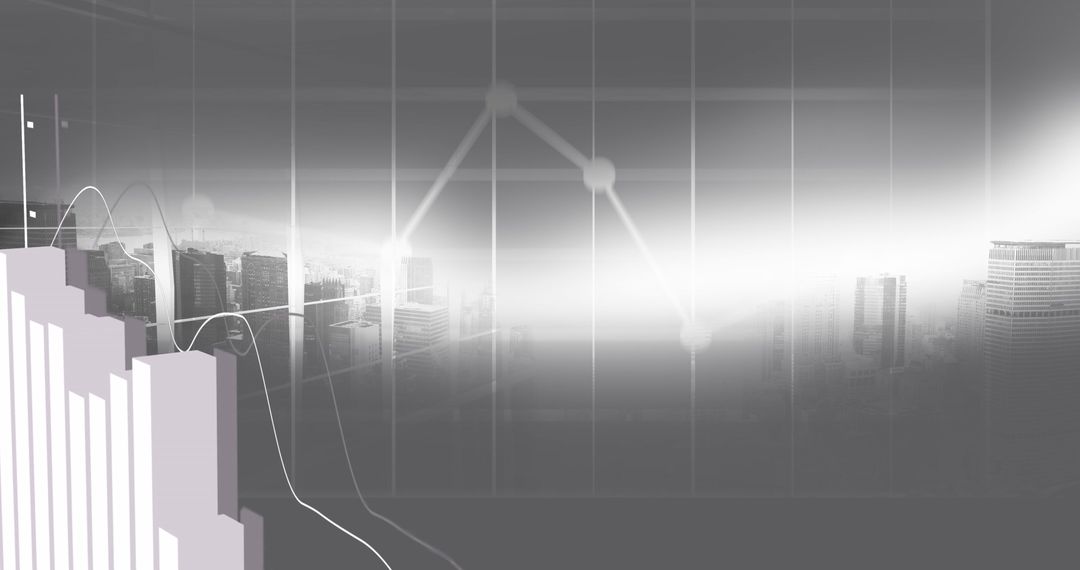
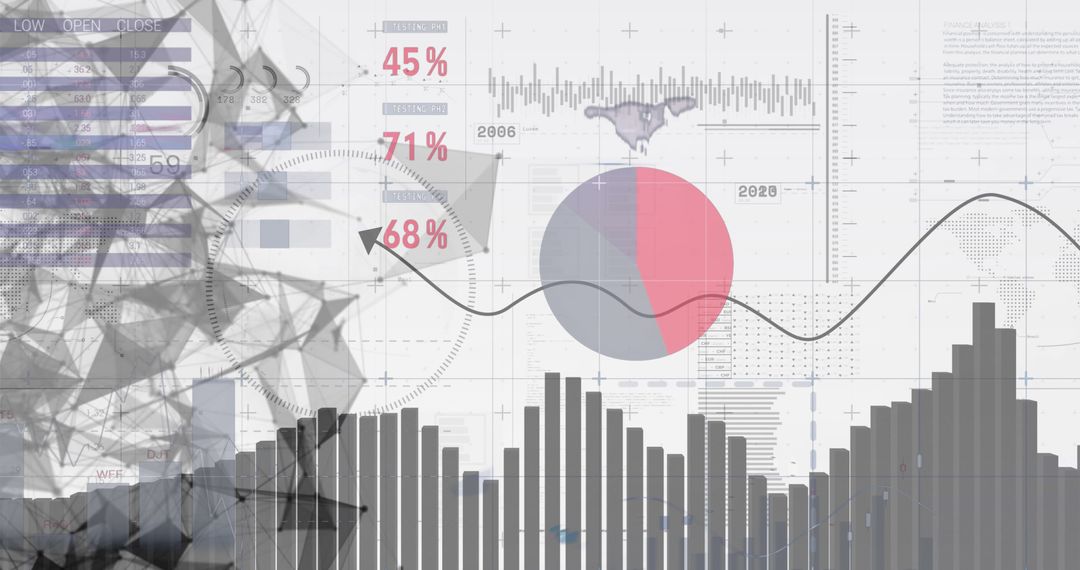
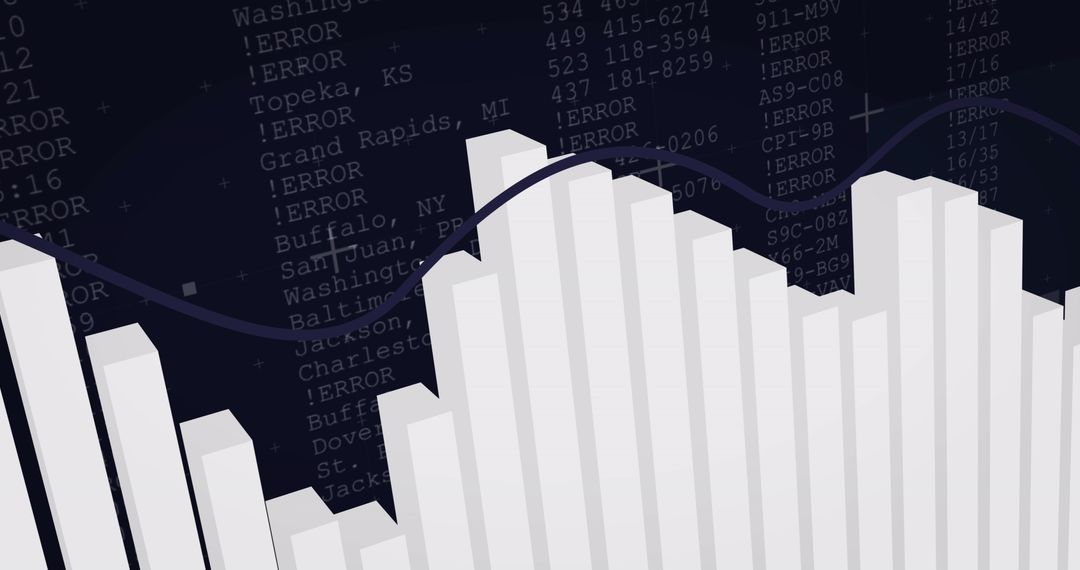
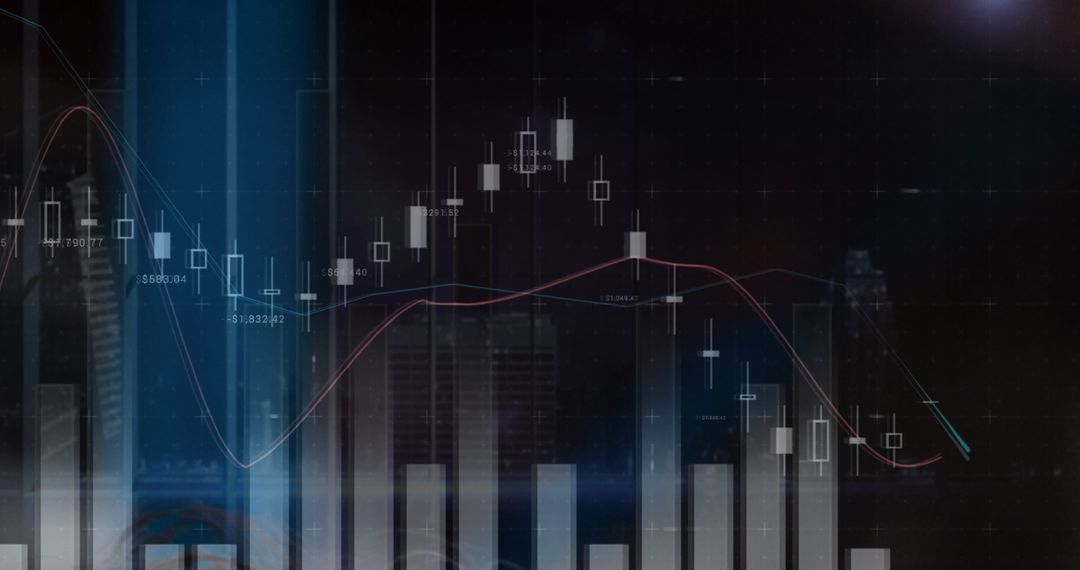
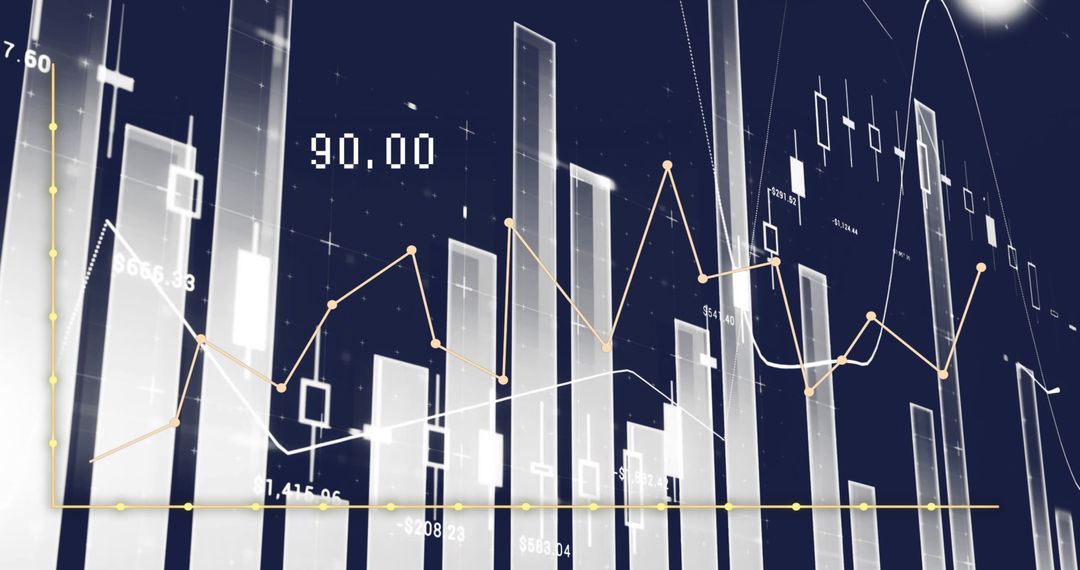
- Financial Data Analysis with Trend Graphs and Bar Charts
Financial Data Analysis with Trend Graphs and Bar Charts Image

Showcasing a dynamic blend of bar charts and trend graphs superimposed on a digital backdrop filled with numerical data. Ideal for presentations related to economics, global business strategy, or finance technology products. Suited for illustrating concepts of modern data visualization, financial assessment, and analytics software tools used in corporate environments.
Powered by 


4
downloads
downloads
Tags:
More
Credit Photo
If you would like to credit the Photo, here are some ways you can do so
Text Link
photo Link
<span class="text-link">
<span>
<a target="_blank" href=https://pikwizard.com/photo/financial-data-analysis-with-trend-graphs-and-bar-charts/e6b956ad4b2f9c793d0abc306176fd16/>PikWizard</a>
</span>
</span>
<span class="image-link">
<span
style="margin: 0 0 20px 0; display: inline-block; vertical-align: middle; width: 100%;"
>
<a
target="_blank"
href="https://pikwizard.com/photo/financial-data-analysis-with-trend-graphs-and-bar-charts/e6b956ad4b2f9c793d0abc306176fd16/"
style="text-decoration: none; font-size: 10px; margin: 0;"
>
<img src="https://pikwizard.com/pw/medium/e6b956ad4b2f9c793d0abc306176fd16.jpg" style="margin: 0; width: 100%;" alt="" />
<p style="font-size: 12px; margin: 0;">PikWizard</p>
</a>
</span>
</span>
Free (free of charge)
Free for personal and commercial use.
Author: People Creations
Similar Free Stock Images
Premium


Premium


Premium


Premium


Premium

Premium

Premium

Premium


Premium


Premium

Premium

Premium


Premium

Premium


Premium


Premium


Premium


Premium


Premium


Premium


Premium


Premium


Premium

Premium