- Home >
- Stock Photos >
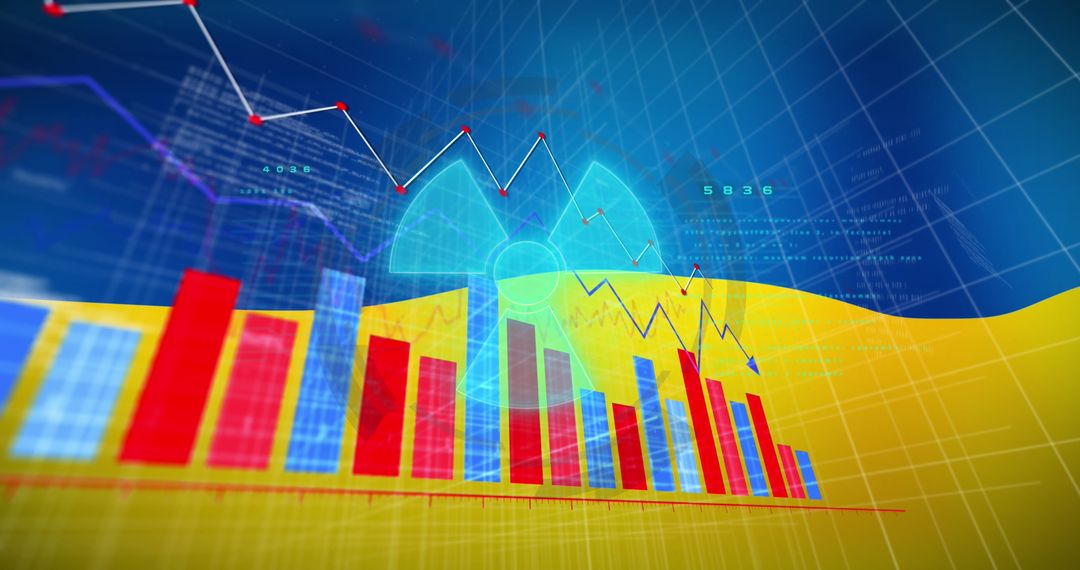
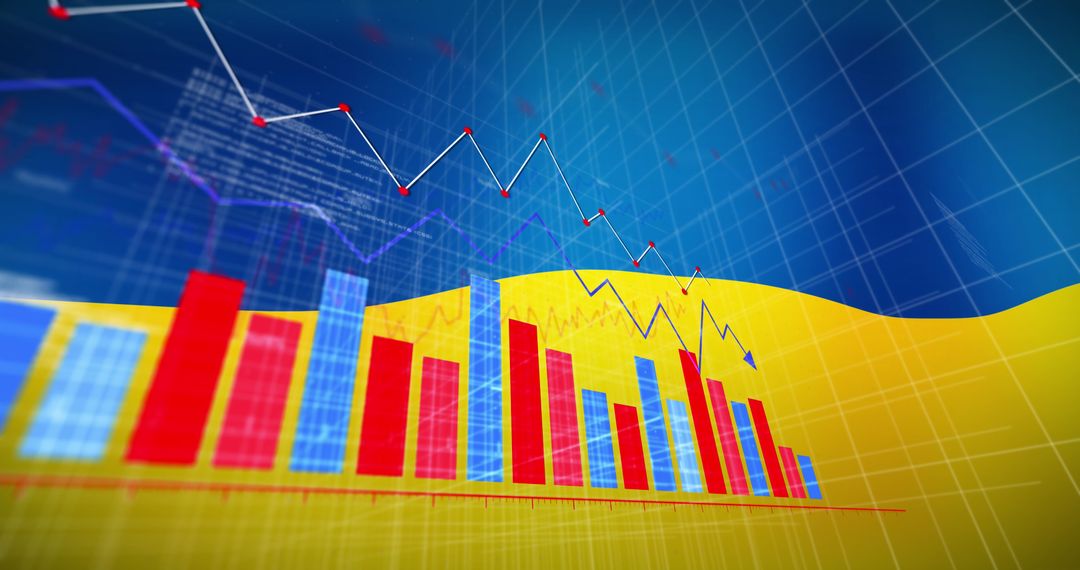
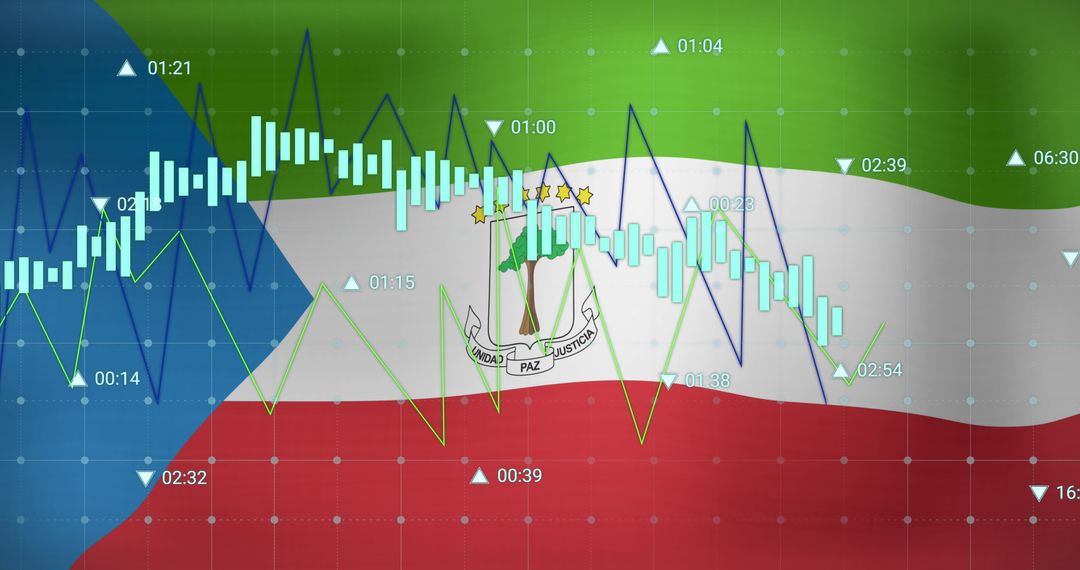
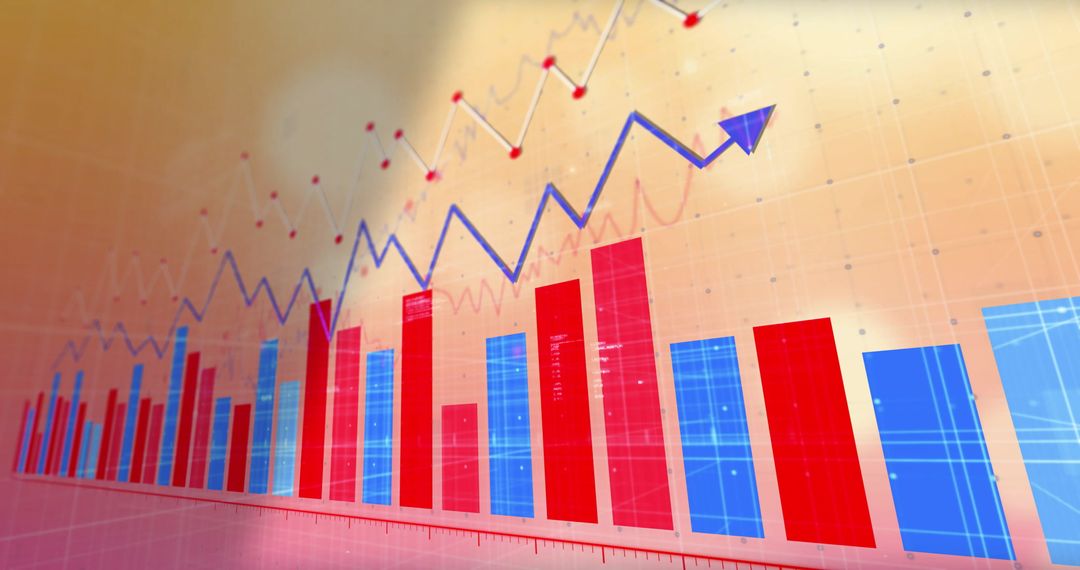
- Financial Data Analytics and Trends with Red and Blue Graph
Financial Data Analytics and Trends with Red and Blue Graph Image
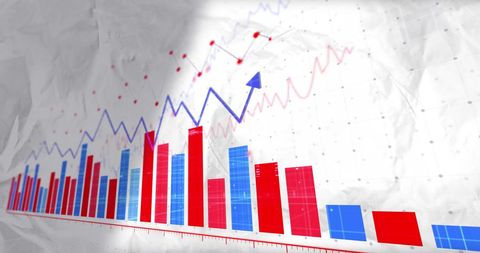
Illustration of red and blue graphs against gridded background showcasing financial data analytics. Bar and line graphs listing economic trends and stock market performance, ideal for presentations, financial reports, business publications, and articles on global finance and data analysis.
Powered by 


2
downloads
downloads
Tags:
More
Credit Photo
If you would like to credit the Photo, here are some ways you can do so
Text Link
photo Link
<span class="text-link">
<span>
<a target="_blank" href=https://pikwizard.com/photo/financial-data-analytics-and-trends-with-red-and-blue-graph/437a2c811cd880f39c9909979589ea4b/>PikWizard</a>
</span>
</span>
<span class="image-link">
<span
style="margin: 0 0 20px 0; display: inline-block; vertical-align: middle; width: 100%;"
>
<a
target="_blank"
href="https://pikwizard.com/photo/financial-data-analytics-and-trends-with-red-and-blue-graph/437a2c811cd880f39c9909979589ea4b/"
style="text-decoration: none; font-size: 10px; margin: 0;"
>
<img src="https://pikwizard.com/pw/medium/437a2c811cd880f39c9909979589ea4b.jpg" style="margin: 0; width: 100%;" alt="" />
<p style="font-size: 12px; margin: 0;">PikWizard</p>
</a>
</span>
</span>
Free (free of charge)
Free for personal and commercial use.
Author: Creative Art
Similar Free Stock Images

Premium


Premium


Premium


Premium


Premium


Premium


Premium


Premium


Premium


Premium


Premium


Premium


Premium


Premium


Premium


Premium


Premium


Premium


Premium


Premium


Premium


Premium


Premium


Premium