
- Home >
- Stock Photos >
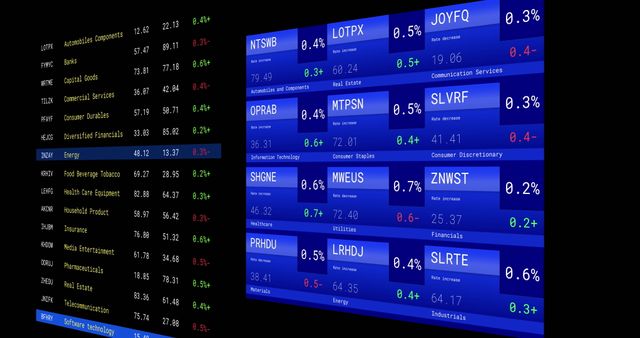
- Financial Data Analytics Display with Digital Figures
Financial Data Analytics Display with Digital Figures Image

This image shows a digital display of numerical figures commonly seen in financial data analytics. It is suitable for illustrating topics related to economics, stock markets, financial services, and data processing technology in articles or presentations. This visual can be ideal for use in web design for finance-related websites or as a background for financial newsletters.
Powered by  - Get 15% off with code: PIKWIZARD15


downloads
Tags:
More
Credit Photo
If you would like to credit the Photo, here are some ways you can do so
Text Link
photo Link
<span class="text-link">
<span>
<a target="_blank" href=https://pikwizard.com/photo/financial-data-analytics-display-with-digital-figures/c6ff41a6c44512d290039f1de1654db5/>PikWizard</a>
</span>
</span>
<span class="image-link">
<span
style="margin: 0 0 20px 0; display: inline-block; vertical-align: middle; width: 100%;"
>
<a
target="_blank"
href="https://pikwizard.com/photo/financial-data-analytics-display-with-digital-figures/c6ff41a6c44512d290039f1de1654db5/"
style="text-decoration: none; font-size: 10px; margin: 0;"
>
<img src="https://pikwizard.com/pw/medium/c6ff41a6c44512d290039f1de1654db5.jpg" style="margin: 0; width: 100%;" alt="" />
<p style="font-size: 12px; margin: 0;">PikWizard</p>
</a>
</span>
</span>
Free (free of charge)
Free for personal and commercial use.
Author: Awesome Content
Similar Free Stock Images

Premium


Premium


Premium


Premium


Premium


Premium


Premium

Premium


Premium


Premium


Premium


Premium


Premium

Premium

Premium


Premium


Premium


Premium


Premium


Premium


Premium

Premium


Premium


Premium


Premium


Explore More Free Stock Images