- Home >
- Stock Photos >
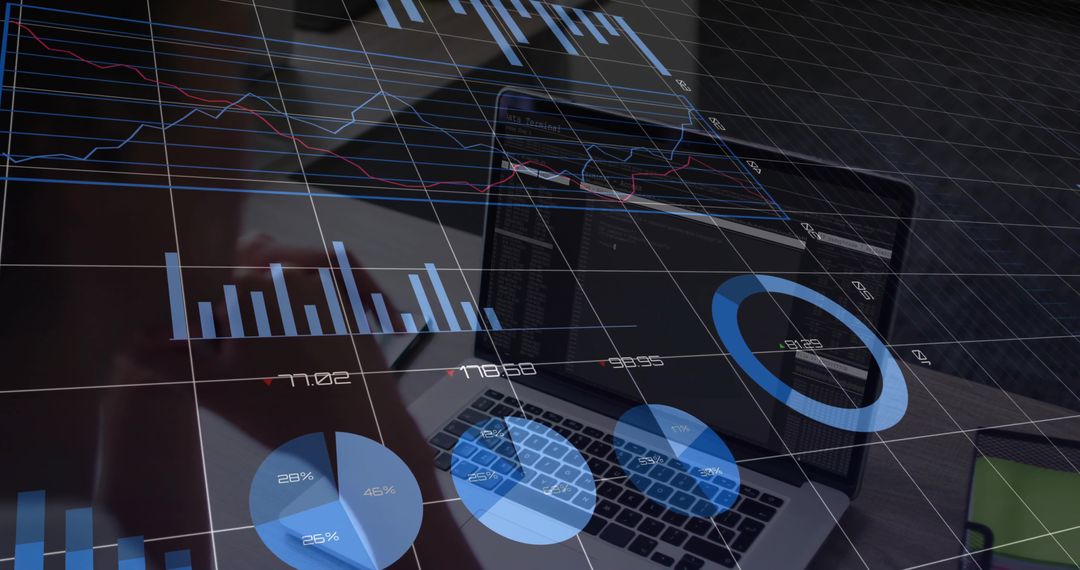
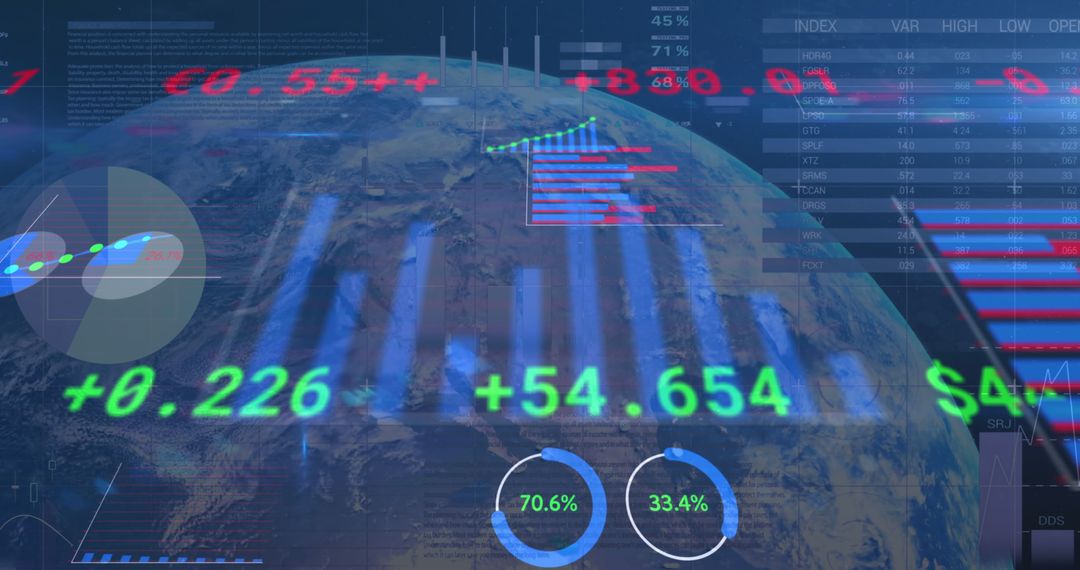
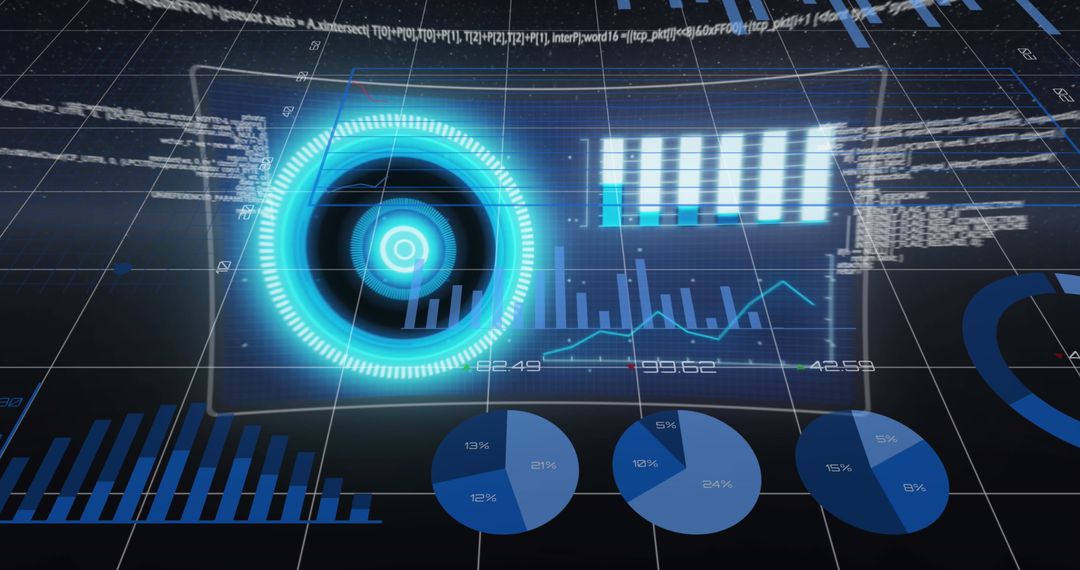
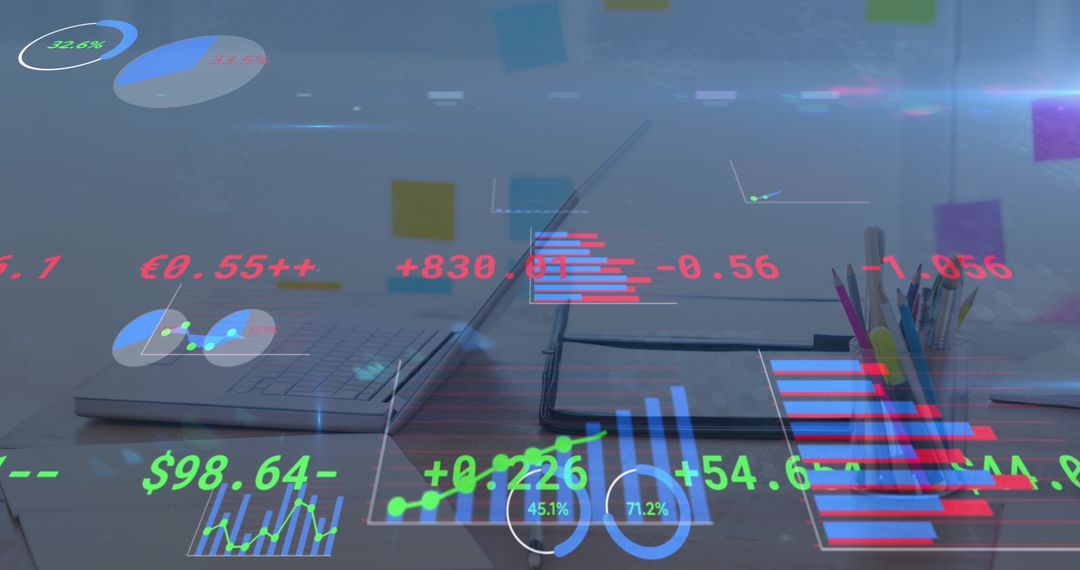
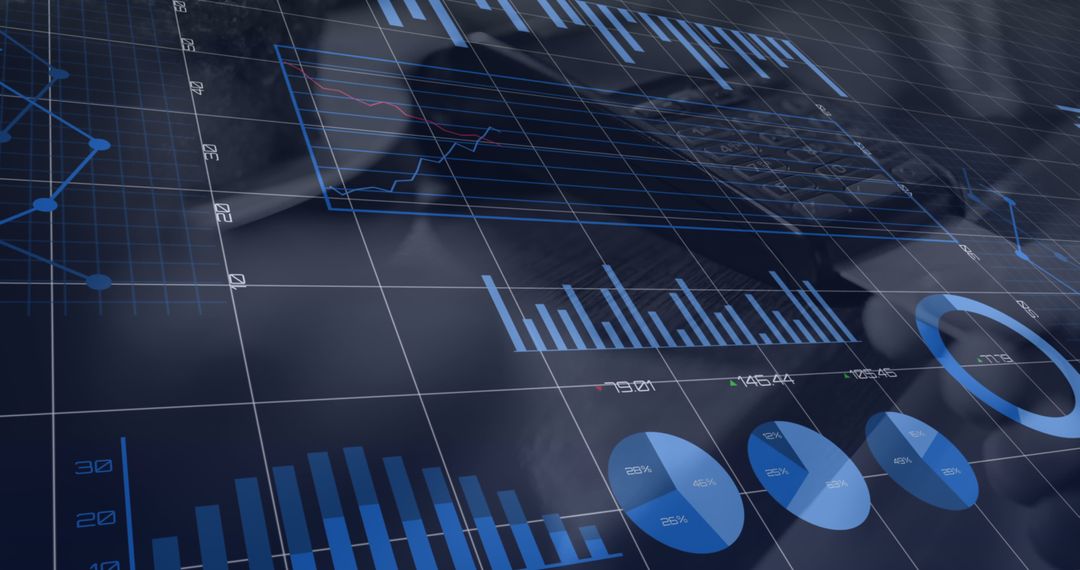
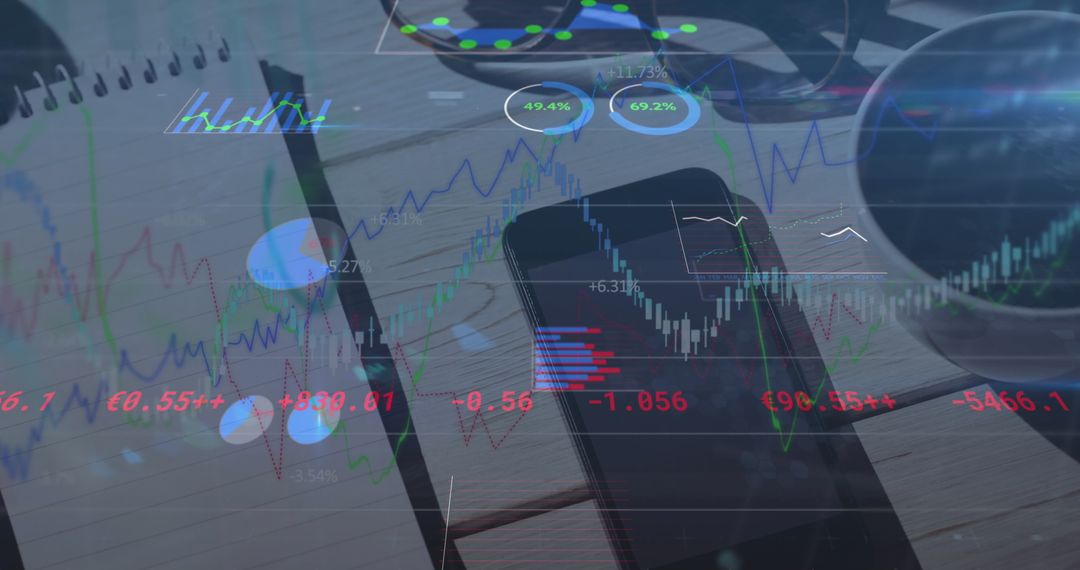
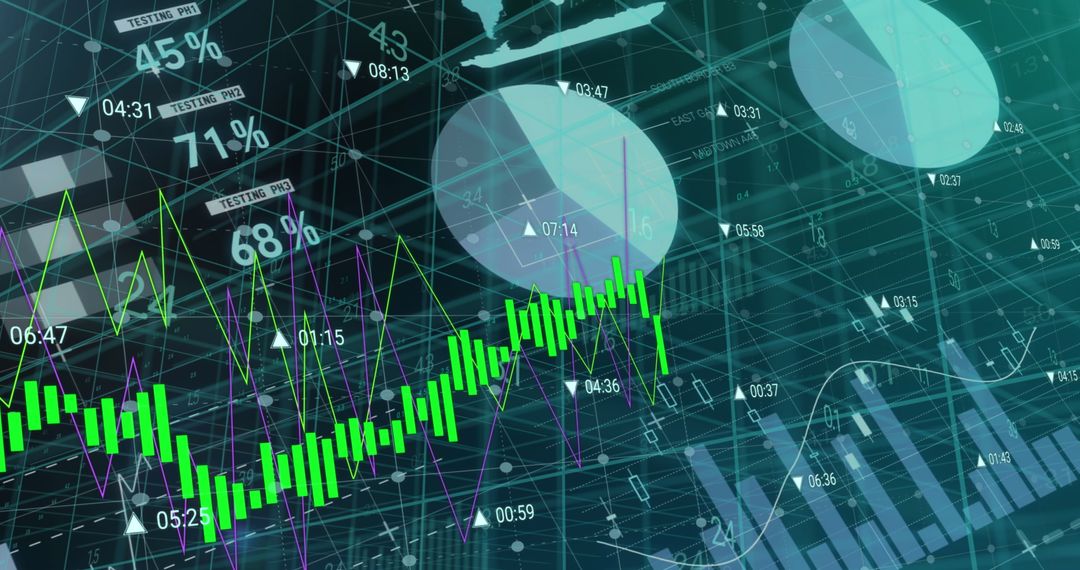
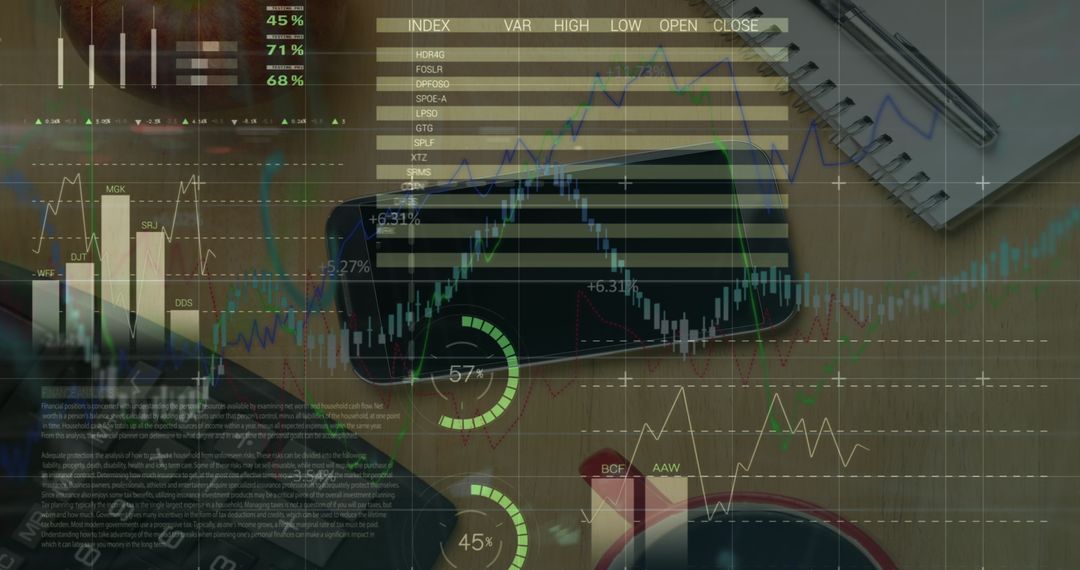
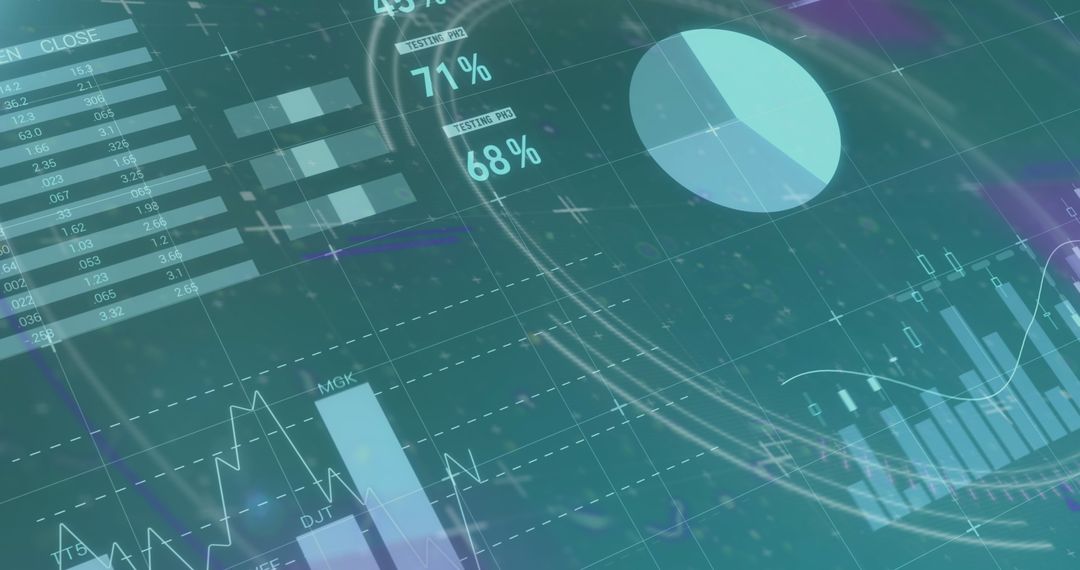
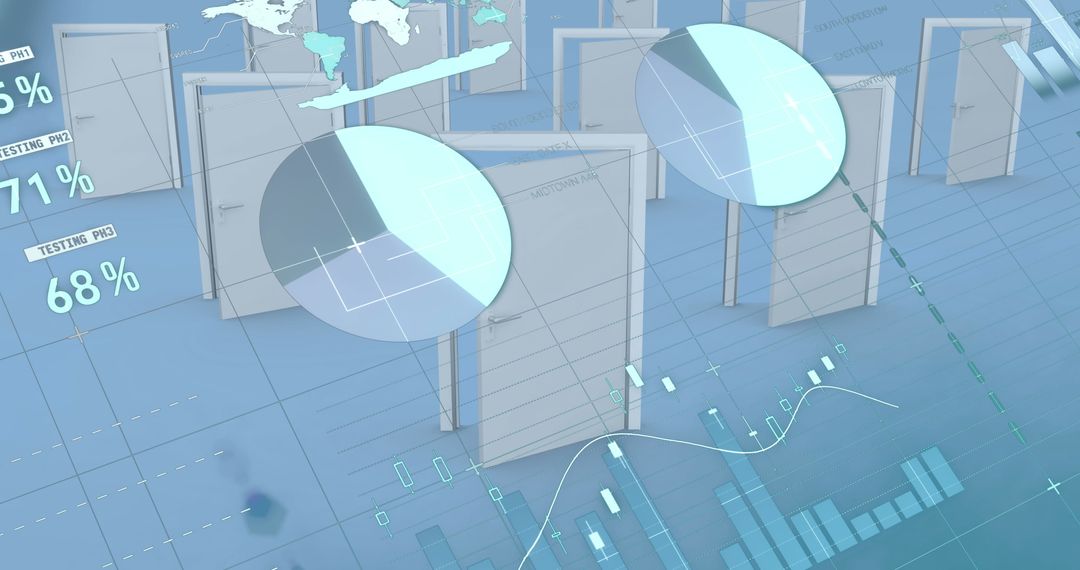
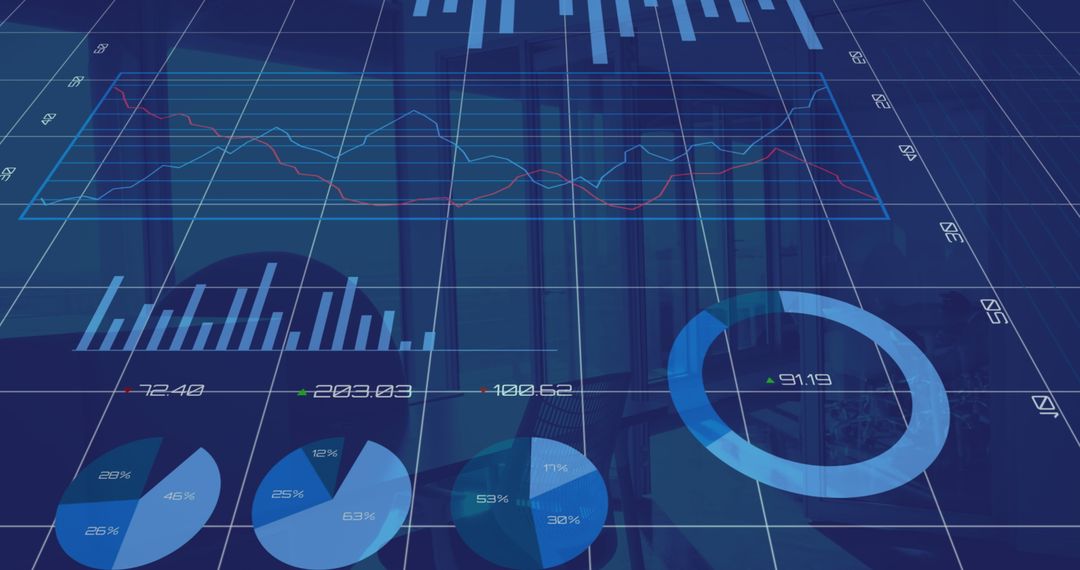
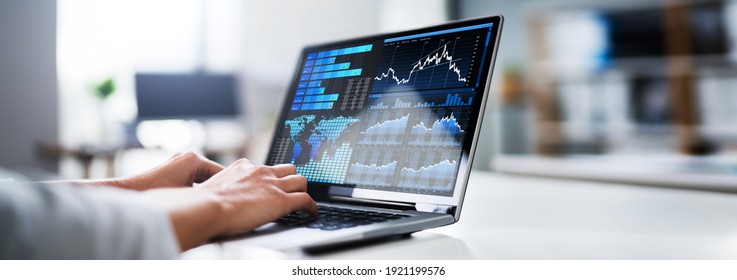
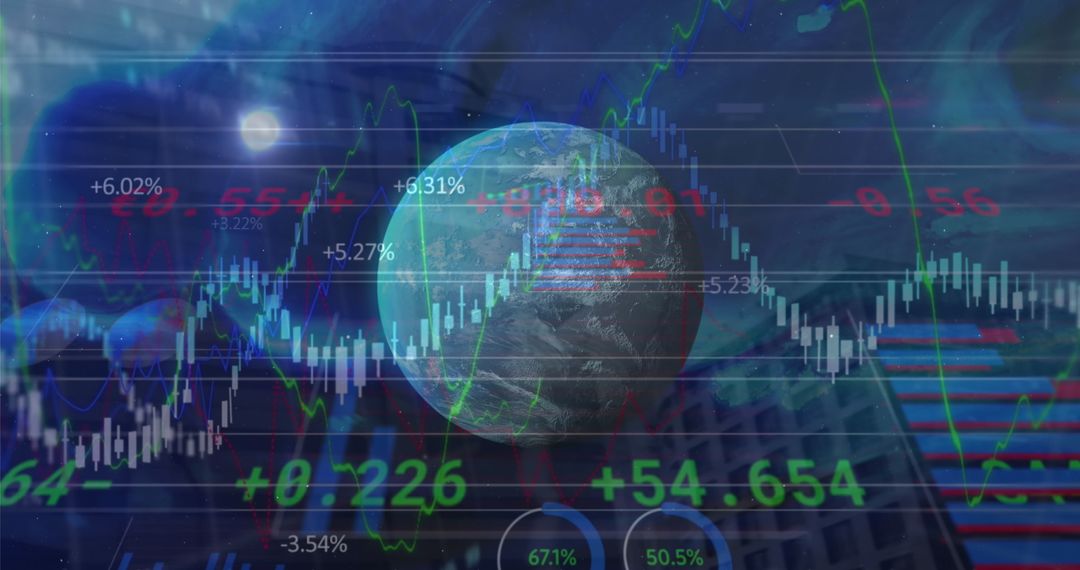
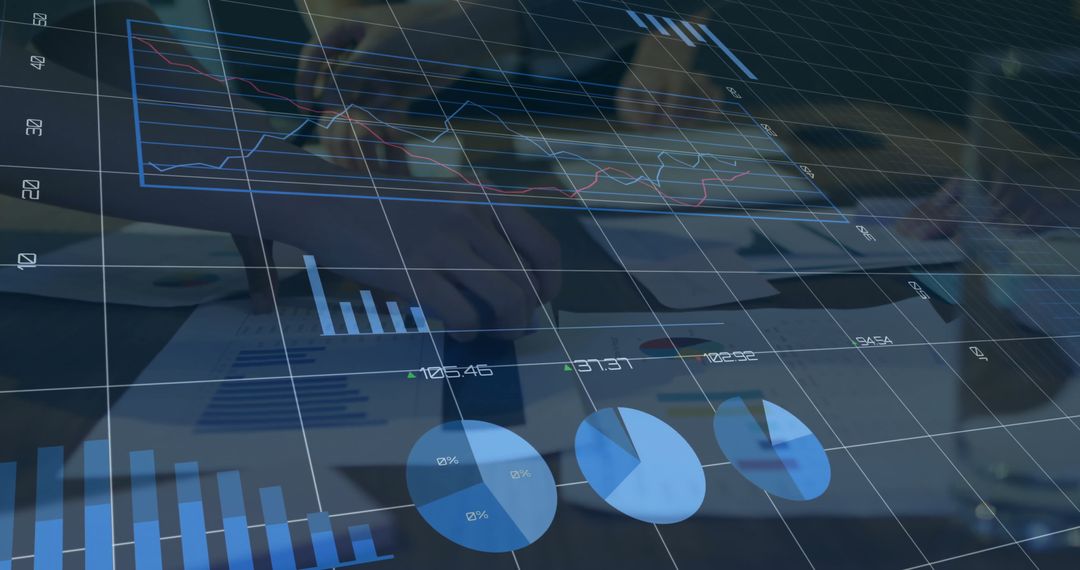
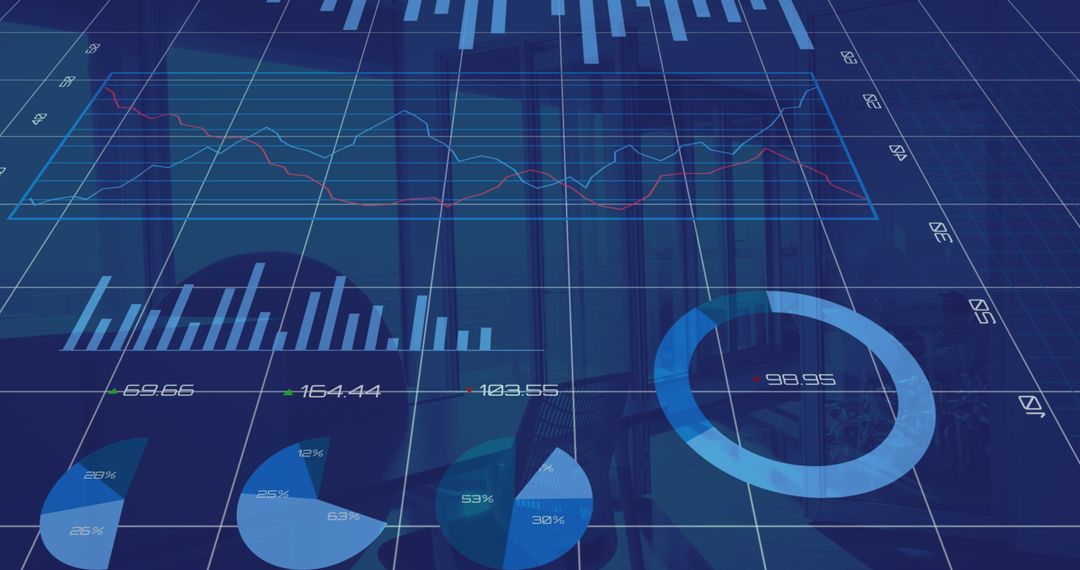
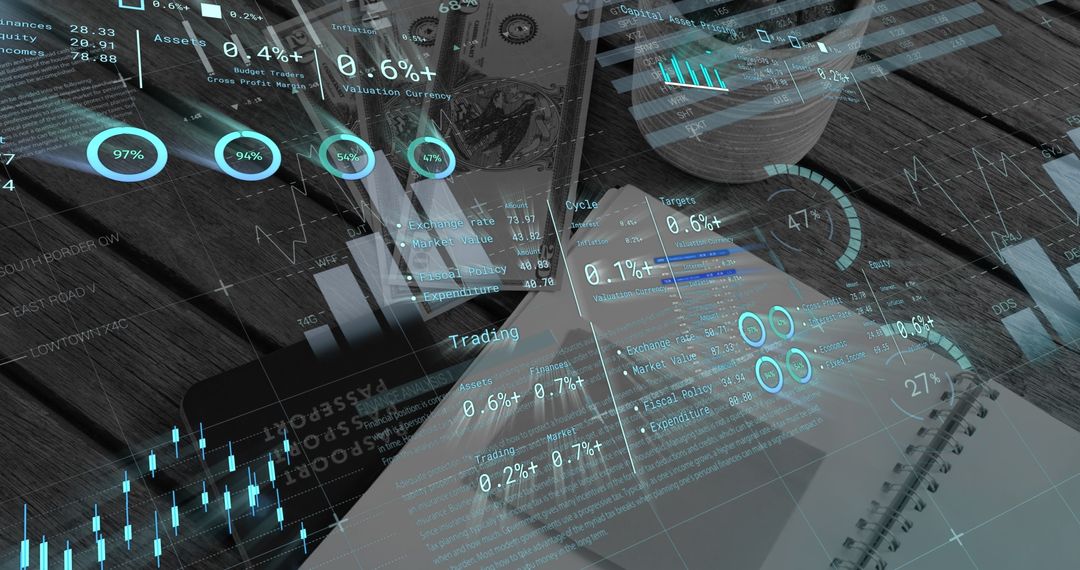
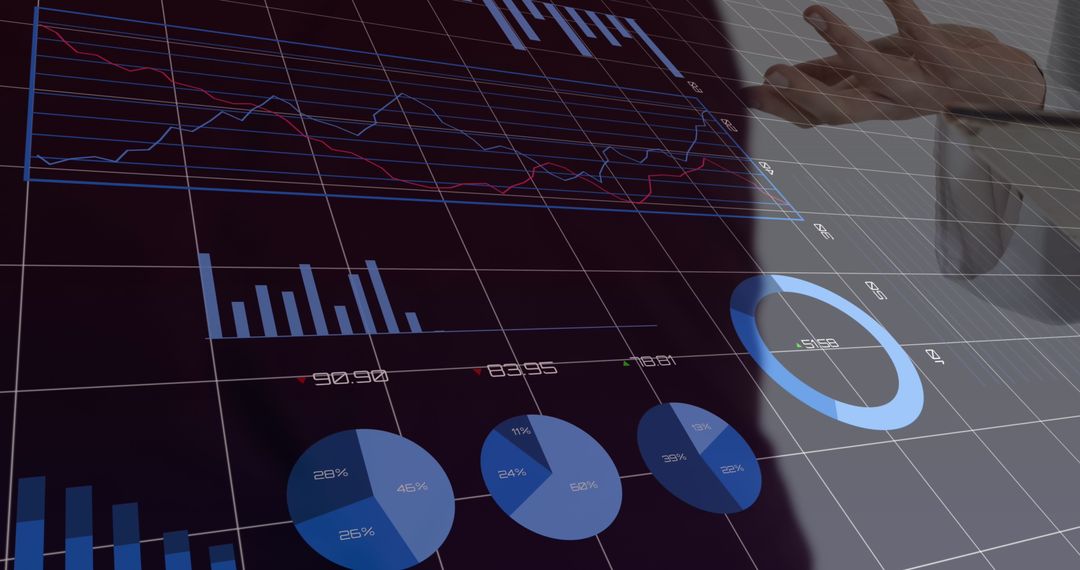
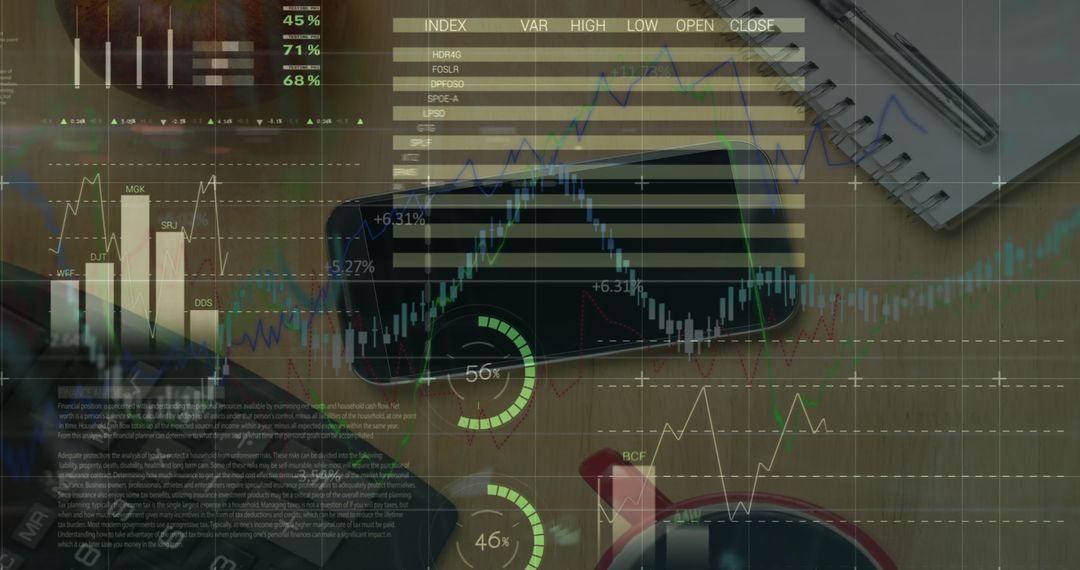
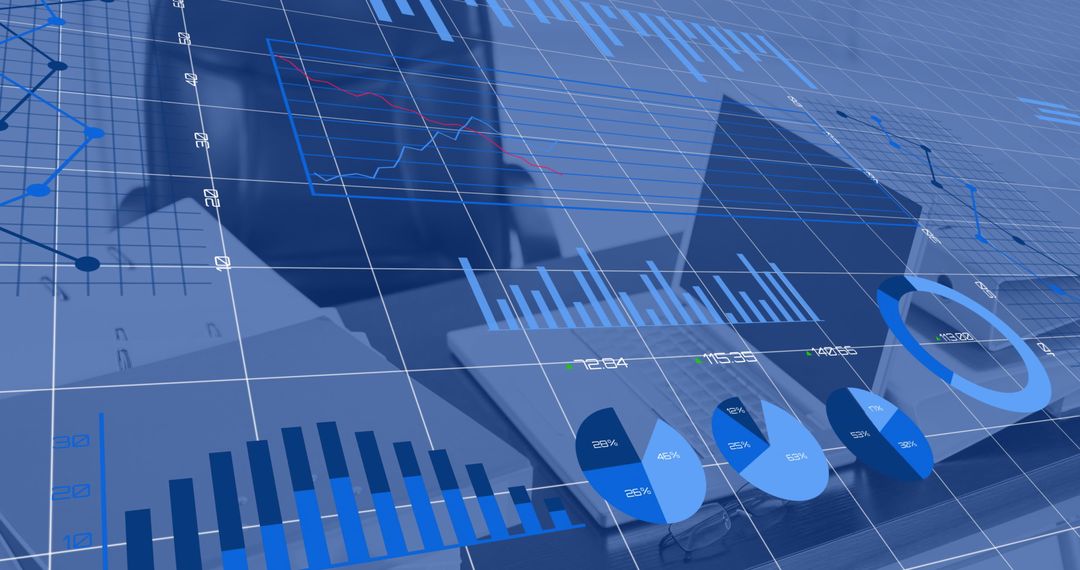
- Financial Data Analytics on Desk with Smartphone and Notebook
Financial Data Analytics on Desk with Smartphone and Notebook Image
Display showcases layered financial charts on top of an office desk, integrating modern technology with traditional tools such as a notebook and pen. Suitable for illustrating investment trends, insights for financial consultancy advertisements, articles on fintech growth, or educational content in university career advising materials.
Powered by  - Get 15% off with code: PIKWIZARD15


4
downloads
downloads
Tags:
More
Credit Photo
If you would like to credit the Photo, here are some ways you can do so
Text Link
photo Link
<span class="text-link">
<span>
<a target="_blank" href=https://pikwizard.com/photo/financial-data-analytics-on-desk-with-smartphone-and-notebook/2eb8473e5096fac8f0bd8addde10bfa0/>PikWizard</a>
</span>
</span>
<span class="image-link">
<span
style="margin: 0 0 20px 0; display: inline-block; vertical-align: middle; width: 100%;"
>
<a
target="_blank"
href="https://pikwizard.com/photo/financial-data-analytics-on-desk-with-smartphone-and-notebook/2eb8473e5096fac8f0bd8addde10bfa0/"
style="text-decoration: none; font-size: 10px; margin: 0;"
>
<img src="https://pikwizard.com/pw/medium/2eb8473e5096fac8f0bd8addde10bfa0.jpg" style="margin: 0; width: 100%;" alt="" />
<p style="font-size: 12px; margin: 0;">PikWizard</p>
</a>
</span>
</span>
Free (free of charge)
Free for personal and commercial use.
Author: Creative Art
Similar Free Stock Images
Premium


Premium


Premium


Premium


Premium


Premium


Premium

Premium


Premium


Premium


Premium


Premium


Premium


Premium


Premium

Premium


Premium

Premium


Premium


Premium


Premium

Premium


Premium


Premium