
- Home >
- Stock Photos >
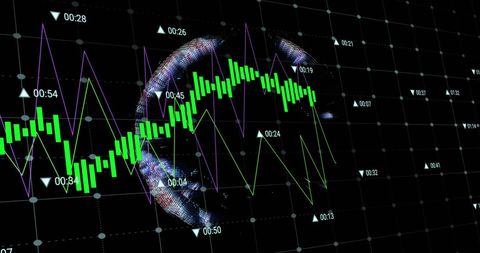
- Financial Data Analytics on Neon Black Grid Background
Financial Data Analytics on Neon Black Grid Background Image

Depicts digital financial data being analyzed on a neon-lit grid background. Ideal for illustrating concepts in finance technology, business analytics, or global market trends. Useful for presentations, articles, or website banners related to data science, economic forecasting, and technological advancement in financial sectors.
Powered by 


downloads
Tags:
More
Credit Photo
If you would like to credit the Photo, here are some ways you can do so
Text Link
photo Link
<span class="text-link">
<span>
<a target="_blank" href=https://pikwizard.com/photo/financial-data-analytics-on-neon-black-grid-background/e4e5acb5225d0b0f3d5efa13f1f5ce93/>PikWizard</a>
</span>
</span>
<span class="image-link">
<span
style="margin: 0 0 20px 0; display: inline-block; vertical-align: middle; width: 100%;"
>
<a
target="_blank"
href="https://pikwizard.com/photo/financial-data-analytics-on-neon-black-grid-background/e4e5acb5225d0b0f3d5efa13f1f5ce93/"
style="text-decoration: none; font-size: 10px; margin: 0;"
>
<img src="https://pikwizard.com/pw/medium/e4e5acb5225d0b0f3d5efa13f1f5ce93.jpg" style="margin: 0; width: 100%;" alt="" />
<p style="font-size: 12px; margin: 0;">PikWizard</p>
</a>
</span>
</span>
Free (free of charge)
Free for personal and commercial use.
Author: Authentic Images
Similar Free Stock Images

Premium


Premium


Premium

Premium


Premium


Premium


Premium


Premium

Premium


Premium


Premium


Premium

Premium


Premium


Premium

Premium


Premium


Premium


Premium

Premium


Premium


Premium

Premium


Premium


Premium


Explore More Free Stock Images