- Home >
- Stock Photos >
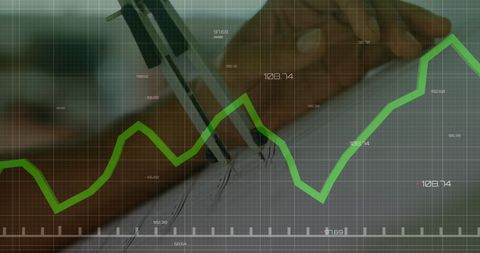
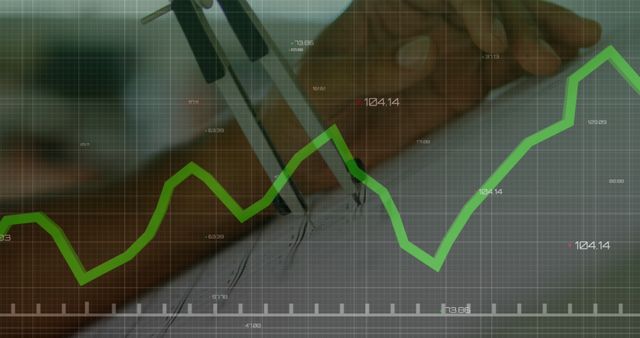
- Financial Data Analytics on Tablet with Digital Overlay Concept
Financial Data Analytics on Tablet with Digital Overlay Concept Image

Visual representation of hands interacting with a tablet device, featuring a vibrant digital data overlay suggesting financial data analysis. Ideal for illustrating themes around modern finance, digital transformation in business, or advanced data processing techniques. Useful for articles, presentations, and marketing materials focusing on technology in the financial industry or data analytics strategies.

downloads
Tags:
More
Credit Photo
If you would like to credit the Photo, here are some ways you can do so
Text Link
photo Link
<span class="text-link">
<span>
<a target="_blank" href=https://pikwizard.com/photo/financial-data-analytics-on-tablet-with-digital-overlay-concept/a95723503eea6dca9ada7c1b1c35c799/>PikWizard</a>
</span>
</span>
<span class="image-link">
<span
style="margin: 0 0 20px 0; display: inline-block; vertical-align: middle; width: 100%;"
>
<a
target="_blank"
href="https://pikwizard.com/photo/financial-data-analytics-on-tablet-with-digital-overlay-concept/a95723503eea6dca9ada7c1b1c35c799/"
style="text-decoration: none; font-size: 10px; margin: 0;"
>
<img src="https://pikwizard.com/pw/medium/a95723503eea6dca9ada7c1b1c35c799.jpg" style="margin: 0; width: 100%;" alt="" />
<p style="font-size: 12px; margin: 0;">PikWizard</p>
</a>
</span>
</span>
Free (free of charge)
Free for personal and commercial use.
Author: Authentic Images