- Home >
- Stock Photos >
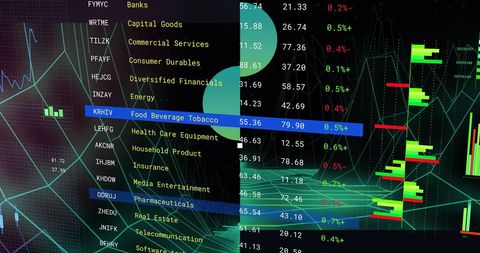
- Financial Data Analytics Over Digital Display Interface
Financial Data Analytics Over Digital Display Interface Image
Financial visualization illustrating dynamic data analytics and processing set against a digital display. Useful for financial services marketing, technology presentations, economic analyses, and business intelligence showcases.

downloads
Tags:
More
Credit Photo
If you would like to credit the Photo, here are some ways you can do so
Text Link
photo Link
<span class="text-link">
<span>
<a target="_blank" href=https://pikwizard.com/photo/financial-data-analytics-over-digital-display-interface/f47e0d127c42e939dcd621e90d4140a1/>PikWizard</a>
</span>
</span>
<span class="image-link">
<span
style="margin: 0 0 20px 0; display: inline-block; vertical-align: middle; width: 100%;"
>
<a
target="_blank"
href="https://pikwizard.com/photo/financial-data-analytics-over-digital-display-interface/f47e0d127c42e939dcd621e90d4140a1/"
style="text-decoration: none; font-size: 10px; margin: 0;"
>
<img src="https://pikwizard.com/pw/medium/f47e0d127c42e939dcd621e90d4140a1.jpg" style="margin: 0; width: 100%;" alt="" />
<p style="font-size: 12px; margin: 0;">PikWizard</p>
</a>
</span>
</span>
Free (free of charge)
Free for personal and commercial use.
Author: People Creations