
- Home >
- Stock Photos >
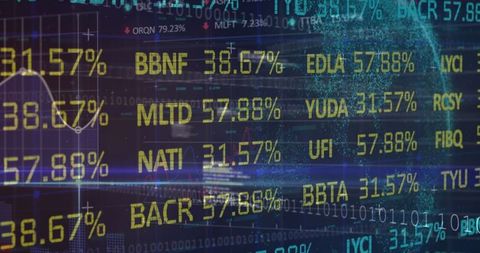
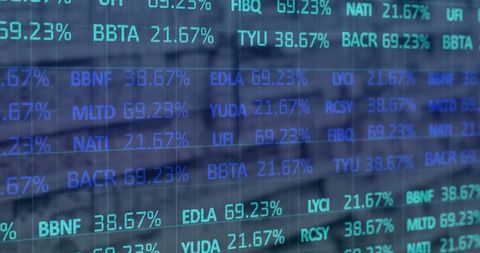
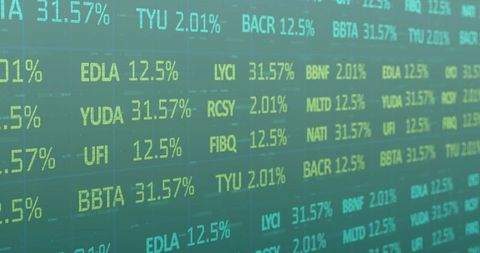
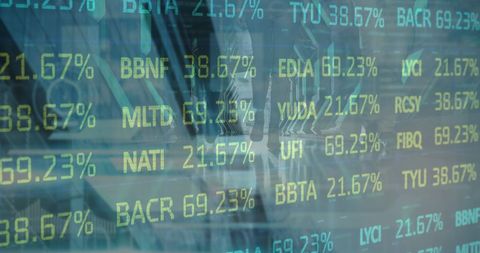
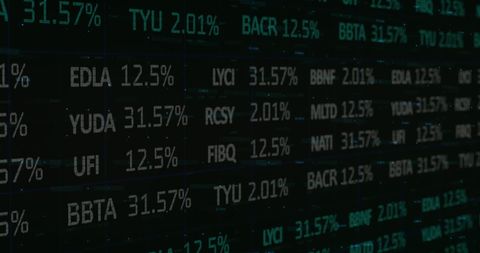
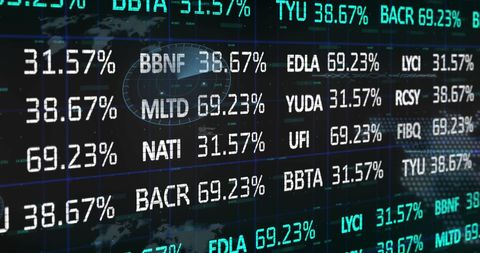
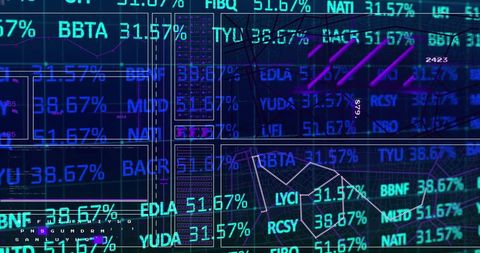
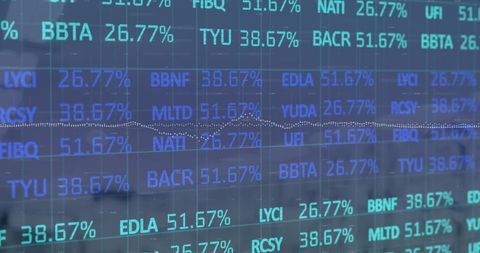
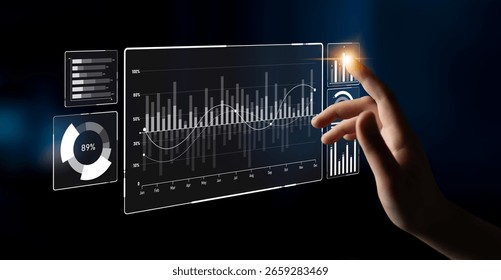
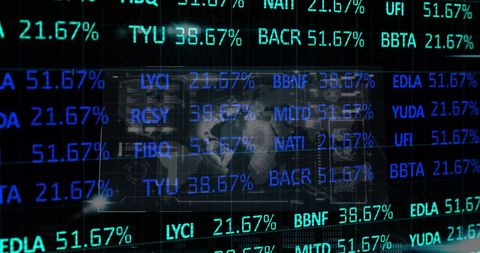
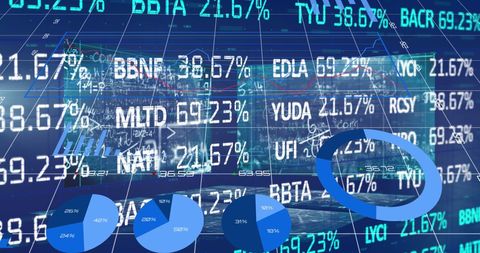
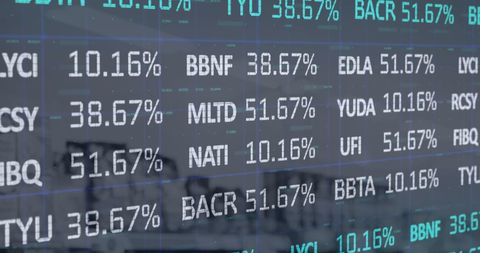
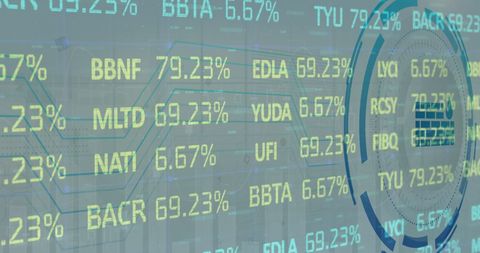
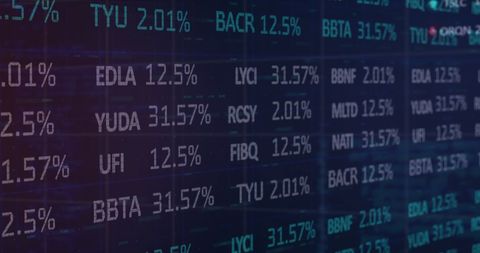
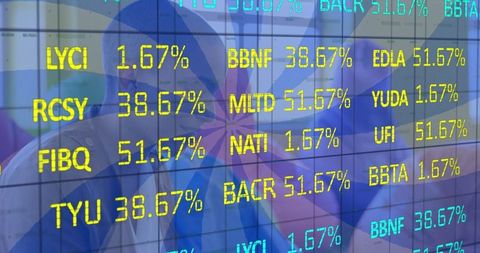
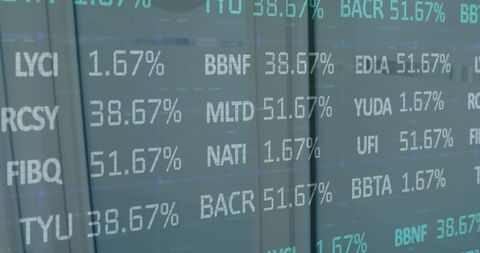
- Financial Data Analytics Overlay on Computer Desk with Global Map
Financial Data Analytics Overlay on Computer Desk with Global Map Image
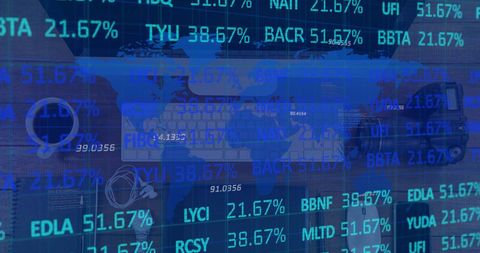
This visual represents high-tech financial data analytics processing overlay on a desk setup with a computer. Great for themes related to global business, financial technology, innovation in commerce, and modern industry practices. Ideal for use in financial reports, technology blogs, or business updates where illustrating data analysis or global commerce connections are essential.
Powered by  - Get 15% off with code: PIKWIZARD15


downloads
Tags:
More
Credit Photo
If you would like to credit the Photo, here are some ways you can do so
Text Link
photo Link
<span class="text-link">
<span>
<a target="_blank" href=https://pikwizard.com/photo/financial-data-analytics-overlay-on-computer-desk-with-global-map/0347ac77bdcae0baa5ff5645925301d3/>PikWizard</a>
</span>
</span>
<span class="image-link">
<span
style="margin: 0 0 20px 0; display: inline-block; vertical-align: middle; width: 100%;"
>
<a
target="_blank"
href="https://pikwizard.com/photo/financial-data-analytics-overlay-on-computer-desk-with-global-map/0347ac77bdcae0baa5ff5645925301d3/"
style="text-decoration: none; font-size: 10px; margin: 0;"
>
<img src="https://pikwizard.com/pw/medium/0347ac77bdcae0baa5ff5645925301d3.jpg" style="margin: 0; width: 100%;" alt="" />
<p style="font-size: 12px; margin: 0;">PikWizard</p>
</a>
</span>
</span>
Free (free of charge)
Free for personal and commercial use.
Author: Awesome Content
Similar Free Stock Images
Premium


Premium


Premium


Premium


Premium


Premium


Premium


Premium


Premium


Premium


Premium


Premium


Premium

Premium

Premium


Premium


Premium


Premium


Premium


Premium


Premium


Premium


Premium

Premium


Premium

Explore More Free Stock Images