- Home >
- Stock Photos >
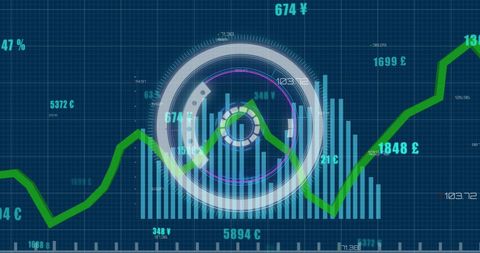
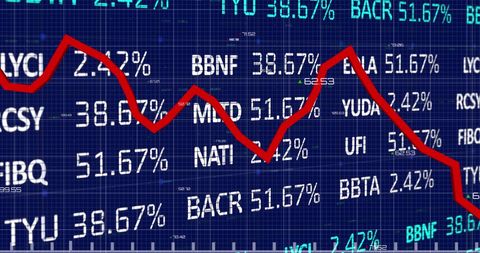
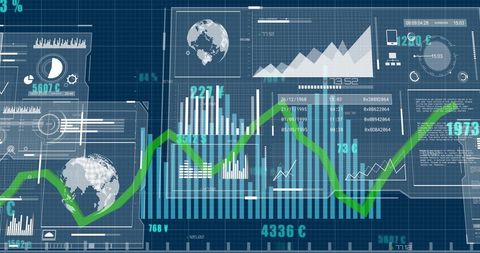
- Financial Data Analytics Overlaying Digital World Map Background
Financial Data Analytics Overlaying Digital World Map Background Image

Display of financial data processing using a digital overlay on a world map, representing global financial dynamics. Ideal for content on financial analysis, economic forecasts, business strategies, international banking, or data visualization in technology-related publications.

downloads
Tags:
More
Credit Photo
If you would like to credit the Photo, here are some ways you can do so
Text Link
photo Link
<span class="text-link">
<span>
<a target="_blank" href=https://pikwizard.com/photo/financial-data-analytics-overlaying-digital-world-map-background/9b2011936f6f10979242815e35542e3d/>PikWizard</a>
</span>
</span>
<span class="image-link">
<span
style="margin: 0 0 20px 0; display: inline-block; vertical-align: middle; width: 100%;"
>
<a
target="_blank"
href="https://pikwizard.com/photo/financial-data-analytics-overlaying-digital-world-map-background/9b2011936f6f10979242815e35542e3d/"
style="text-decoration: none; font-size: 10px; margin: 0;"
>
<img src="https://pikwizard.com/pw/medium/9b2011936f6f10979242815e35542e3d.jpg" style="margin: 0; width: 100%;" alt="" />
<p style="font-size: 12px; margin: 0;">PikWizard</p>
</a>
</span>
</span>
Free (free of charge)
Free for personal and commercial use.
Author: Authentic Images