1. Home > 
  2. Stock Photos > 
  3. Financial Data Analytics Superimposed Over Computer Servers

Financial Data Analytics Superimposed Over Computer Servers Image

Financial Data Analytics Superimposed Over Computer Servers

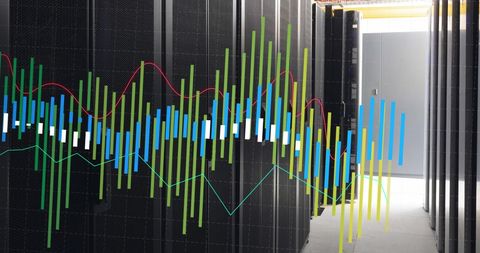
Visual represents integration of financial data analysis with cloud computing and data management technology. Multi-colored graphs illustrate complex data processing and analytics over layered computer server setup. Useful for themes involving technology in fintech sectors, big data analysis, and innovations in global data management.

Powered by Adobe logo
Businessman in suit viewing global data screen with illuminated server racks, contemplative mood - Powered by AdobePerson working on computer with advanced data security interface - Powered by AdobeFinancial data high technology level financial planning concept digital dna glow - Powered by AdobeFuturistic smartphone showing 3D financial analytics and digital asset growth - Powered by AdobeVirtual AI Cloud storage database system, data link file storage digital transformation technology, file access, doc sharing business finance, AI-powered analyze big data analyze, data management - Powered by Adobe

Credit Photo

If you would like to credit the Photo, here are some ways you can do so

Free (free of charge)

Free for personal and commercial use.

Author: Creative Art

Similar Free Stock Images

Neon Fingerprint Lock Overlaying Red and Green Candlesticks on Digital Grid
Premium
Exploring cloud computing cost efficiency in modern data management strategies and financial planning for businesses and organizations
Technology Interface with Business Data Analysis Charts
Financial Data Processing on Dynamic Digital Interface
Premium
Dynamic 3D illustration of a rocket launching from a computer screen, symbolizing digital business growth, startup success, and strategic data analytics with a sleek, modern aesthetic
Financial Graph with Icons in Modern Server Room
Dynamic Financial Data Chart with Rising Bars and Trend Lines
Bar Chart with Line Graph on Automotive Technology Background
Digital Financial Data Analysis with Vibrant Graphs
Premium
Data center with a blurred image of the data. Video of financial information server with realistic visualization. International commerce and financial management room with lifestyle interfaces.
Dynamic Data Visualization with Bar Charts and Line Graphs in Digital Interface
Abstract Digital Graphs on Black Background
Abstract Financial Data Visualization with Graphs
Vibrant Financial Candlestick Chart with Trend Lines
Premium
Big data analytics network lines over digital world map
Dynamic Financial Graph Displaying Market Trends with Bar and Line Charts
Financial Data Processing Visualization with Colorful Bar Charts
Data Processing and Digital Analysis in Server Room
Dynamic Financial Analytics Interface with Colorful Data Visualizations
Premium
Businessman in suit viewing glowing data chart in server room, contemplative mood
Premium
Hands typing on a laptop, engaging with a futuristic interface showing a decentralized blockchain network and digital currency data
Multicolored Data Visualization on Wooden Desk for Insightful Analysis
Financial Data Overlays in Modern Office Workspace
Financial Data Processing Servers for Cloud Computing
Dynamic Financial Data Charts Histogram
Premium
Isometric data analytics platform with a growing bar chart. Digital technology and business intelligence concept for financial growth.
Multi-Colored Charts Superimposed Over Urban Skyline
Data Analytics Overlaid on Modern Office Workspace
Financial Data Visualization Over Server Racks Concept
High-Tech Data Center with Digital Connections Overlay
Neon Financial Data Visualization with Multicolored Candlestick Bars and Trend Lines
Modern Office with Data Analytics Visualization Overlay
Data Visualization with Diagrams on Green Gradient
Data Processing in Futuristic Server Room with Trade Analytics
Tech Growth Analysis with Dynamic Data Visualization
Neon Candlestick Trading Chart Visualizing Market Trends, Financial Data and Analytics
Premium
Cloud computing cost analysis with a glowing digital graph and hands typing on a laptop keyboard
Cityscape with Data Visualization Overlay Exhibiting Urban Analytics
Premium
Abstract background of glowing transparent cubes connected by lines, representing a decentralized network, blockchain technology, or global data exchange
Digital Analytics and Cybersecurity on Blue Tech Background
Digital Analytics Dashboard with Code and Graphs Visualization
Financial Data Visualization Overlaying Workspace
Digital Candlestick Chart on Virtual Grid in Blue Tone
Premium
Ai chip boosting data performance with glowing bar graph processor display conveying innovation
Financial Data Analysis Overlay on Computer Servers in Data Center
Financial Data Overlaid on Server Room Showing Business Growth
Displaying Energy Market Analytics with Candlestick Charts, Histograms and Oil Pump Jack
Global Financial Data on Virtual Screen Displaying Stock Market Trends
Premium
Blue cloud with upward pointing arrows. Represents data upload, tech growth, digital progress, and cloud computing advancement. Abstract concept of digital transformation.
Data Processing Display on Modern Server Infrastructure
Financial Data Analysis Displayed on Server Infrastructure
Digital Data Processing with DNA Helix Overlay
Digital Data Graphs with Blue Background and Light Flare
Premium
Abstract digital data analytics visualization in pink colors
Colorful Financial Data Analytics and Digital Graph
Dynamic Financing Data Visualization on Hungary Flag
Global Financial Data Overlay on World Map for Business Analysis
Digital Security Analytics Overlaid on Data Center Servers
Premium
Cloud computing financial investment technology with digital glowing network data
Candlestick Chart Illustrating Financial Trends and Analytics
Premium
Dynamic digital information flow on a vibrant abstract waveform, symbolizing efficient data organization, analysis, and secure management in the modern business landscape
Digital Stock Market Data with Upward Trend Graph
Business Team Collaborating on Financial Data Analytics in Office
Premium
Abstract blue technology and finance background with pixel patterns, futuristic fintech design, digital science vector illustration, high-tech innovation concept
Premium
Dynamic digital interface on a modern device, showcasing an intricate network of data points and a clear upward trend, symbolizing technological progress and insightful analytics
Colorful Data Streams in Digital Interface
Digital Financial Graph Overlay on Data Center Servers
Digital Graphs Representing Data and Analytics on Black Background
Premium
Diagram outlining the sequential process of data management, encompassing data acquisition, analytical examination, and various methods for report distribution and delivery
Digital Connections. Modern Data Center with Graphic Overlay
Digital Network Data over Modern Server Racks in Data Center
Neon Candlestick Chart Visualizing Stock Market Data with Glowing Lines, Magenta Markers
Dynamic Financial Data Chart on Blue Background
Premium
Detailed computer screen displaying diverse information and data visualizations computer screen shows complex data visualizations and information.
Colorful Financial Data Visualization on Digital Grid
Financial Data Analytics with Environmental Sustainability Icons
Abstract Financial Charts with Colorful Holographic Effects
Digital Financial Data Visualization with Bar Graphs and Line Charts
Premium
Hand interacting with glowing stock market graph in data center
Digital Graph with Abstract Data on Blue Background
Digital Data Visualization on Futuristic Network Servers
Financial Data Charts in Blue Digital Interface Background
Data Integration in Modern Server Room with High-Tech Graph Overlay
Premium
Digital data network connecting information with futuristic technology
Dynamic Digital Stock Market Chart Analysis
Data Center Server Room with Digital Graph Overlay
Server Room with Multicolored Digital Graphs Presenting Data Analysis and Network Security
Colorful Candlestick Chart With Trend Lines on Digital Background
Premium
Colorful glowing waves of energy ascending in an abstract digital space, symbolizing innovation, data movement, and future technological progress and interconnectedness
Digital Data Visualization with Bars and Waveforms
Abstract Financial Data Background with Dynamic Charts
Digital Data Chart Visualization in Modern Office Environment
Digital Financial Chart with Trend Line and Bar Overlay
Ukrainian Flag with Financial Graphs Depicting Economic Crisis
Abstract Financial Data Analysis and Stock Market Trends
Professional Analyzing Data with Digital Charts Overlay in Modern Office
Colorful Financial Graph with Digital Technology Concept
Business Analytics Concept with Data Graphs and Office Desk
Displaying multi-series bar chart with smooth trend lines and metric callouts on dark navy backgroun
Futuristic Financial Data Analytics on Digital Interface
Dynamic Market Dashboard Showing Candlestick Charts, Trend Lines and Trading Indicators
Futuristic Data Analysis with Bar Graphs and Charts Overlay
Digital Data Interface on World Map Focusing Global Business Analytics
Premium
Conceptual image of financial cloud computing, coins with an illuminated cloud symbol
Abstract Digital Data Processing in High-Tech Server Room
Abstract Digital Chart on Black Background Representing Data Analysis
Dynamic Stock Market Analytics with Graphs and Charts
Dynamic Visualization Chart with 3D Bars and Multicolor Waveforms
Premium
A dynamic visual representing collaboration in data analytics and cloud computing, showcasing hands and keywords associated with machine learning and internet technologies. Amity
Financial Graphs Overlaying Computer Server Room
Financial Data Visualization in High-Tech Server Room
Data Visualization Overlay in Dark Computer Server
Digital Data Dashboard with Vibrant Charts and Floating Symbols
Data Analytics Overlay on Modern Server Room Interiors
Finance Transforming with DNA and Digital Technology
Abstract Financial Data Charts Reflecting Economic Trends
Complex Data Analytics Overlay in High-Tech Server Room
Premium
Advanced robot analyzes complex data on a digital screen
Financial Data Overlaid on DNA with COVID-19 Imagery
Dynamic Financial Data Chart on Dark Digital Dashboard
Futuristic Data Visualization with Neon Grid and Line Charts
Financial Data Insights in Advanced Server Room Environment
Premium
Businessman presenting digital health monitoring interface with server and traffic stats
Explore More Free Stock Images