- Home >
- Stock Photos >
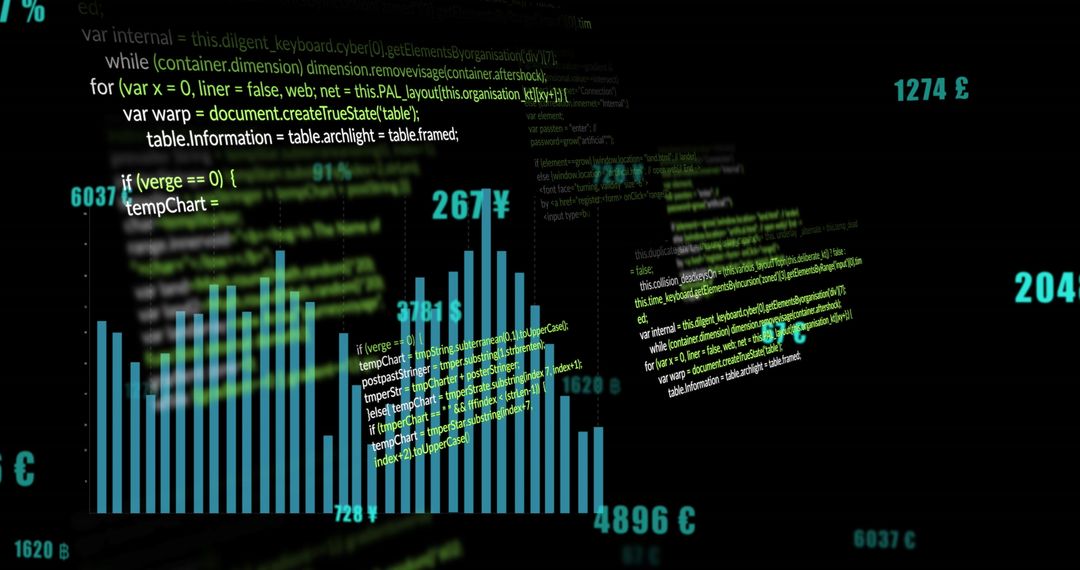
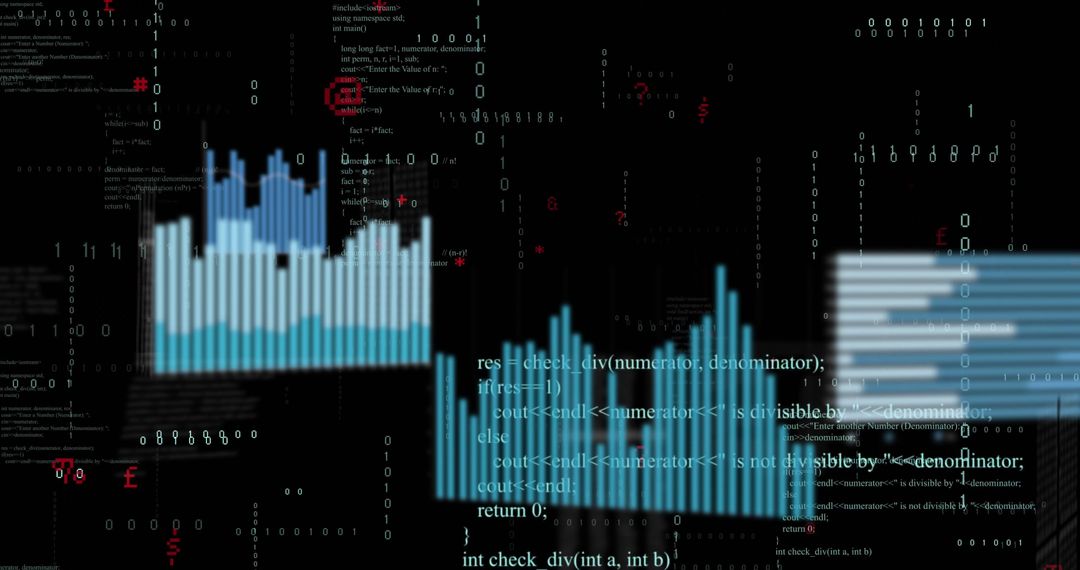
- Financial Data Analytics with Abstract Graphs and Currency Symbols
Financial Data Analytics with Abstract Graphs and Currency Symbols Image
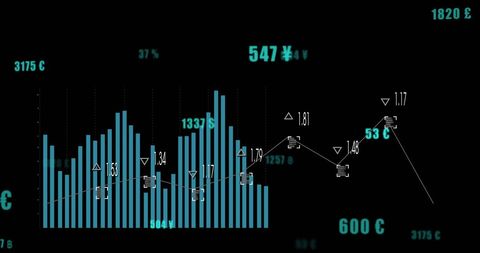
Visualizing financial analytics with complex graphs and currency symbols is ideal for illustrating global economic trends and digital finance strategies. Great use cases include finance magazines, investment blog posts, economic analysis articles, and education on financial technology.
Powered by  - Get 15% off with code: PIKWIZARD15


0
downloads
downloads
Tags:
More
Credit Photo
If you would like to credit the Photo, here are some ways you can do so
Text Link
photo Link
<span class="text-link">
<span>
<a target="_blank" href=https://pikwizard.com/photo/financial-data-analytics-with-abstract-graphs-and-currency-symbols/e7b96a0f501235e1f6f91703c004f528/>PikWizard</a>
</span>
</span>
<span class="image-link">
<span
style="margin: 0 0 20px 0; display: inline-block; vertical-align: middle; width: 100%;"
>
<a
target="_blank"
href="https://pikwizard.com/photo/financial-data-analytics-with-abstract-graphs-and-currency-symbols/e7b96a0f501235e1f6f91703c004f528/"
style="text-decoration: none; font-size: 10px; margin: 0;"
>
<img src="https://pikwizard.com/pw/medium/e7b96a0f501235e1f6f91703c004f528.jpg" style="margin: 0; width: 100%;" alt="" />
<p style="font-size: 12px; margin: 0;">PikWizard</p>
</a>
</span>
</span>
Free (free of charge)
Free for personal and commercial use.
Author: People Creations
Similar Free Stock Images
Premium


Premium


Premium


Premium


Premium


Premium


Premium


Premium


Premium


Premium


Premium


Premium


Premium


Premium


Premium


Premium


Premium


Premium


Premium


Premium


Premium


Premium


Premium


Premium