
- Home >
- Stock Photos >
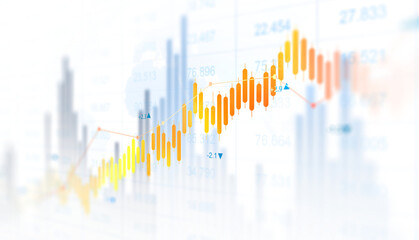
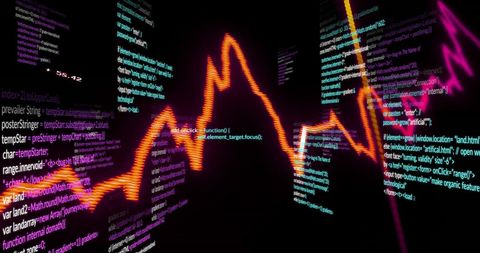
- Financial Data Analytics with Digital Graph Projection
Financial Data Analytics with Digital Graph Projection Image

Vivid green graphs displayed against a digital background, symbolizing the interaction between technology and finance. Coding elements merge with financial datasets to signify data-driven decision-making within global business frameworks. Useful for illustrating futuristic consultations, tech-infused finance services, and digital transformation in corporations.
Powered by 


downloads
Tags:
More
Credit Photo
If you would like to credit the Photo, here are some ways you can do so
Text Link
photo Link
<span class="text-link">
<span>
<a target="_blank" href=https://pikwizard.com/photo/financial-data-analytics-with-digital-graph-projection/eddfd704ab9c30876e78e8f1c2ee6280/>PikWizard</a>
</span>
</span>
<span class="image-link">
<span
style="margin: 0 0 20px 0; display: inline-block; vertical-align: middle; width: 100%;"
>
<a
target="_blank"
href="https://pikwizard.com/photo/financial-data-analytics-with-digital-graph-projection/eddfd704ab9c30876e78e8f1c2ee6280/"
style="text-decoration: none; font-size: 10px; margin: 0;"
>
<img src="https://pikwizard.com/pw/medium/eddfd704ab9c30876e78e8f1c2ee6280.jpg" style="margin: 0; width: 100%;" alt="" />
<p style="font-size: 12px; margin: 0;">PikWizard</p>
</a>
</span>
</span>
Free (free of charge)
Free for personal and commercial use.
Author: Authentic Images
Similar Free Stock Images

Premium


Premium


Premium


Premium


Premium


Premium

Premium


Premium

Premium


Premium


Premium


Premium


Premium


Premium


Premium

Premium

Premium


Premium


Premium


Premium


Premium


Premium


Premium


Premium


Premium


Explore More Free Stock Images