- Home >
- Stock Photos >
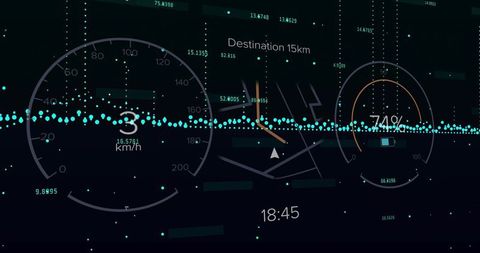
- Financial Data Analytics with Digital Visualization Concept
Financial Data Analytics with Digital Visualization Concept Image

Visualizing complex financial data networks and connections with digital dots and lines against a dark backdrop, representing modern global finance systems and technological innovations in data analysis. Ideal for illustrating finance articles, presentations on data analytics, or explaining computing trends in digital arenas.

downloads
Tags:
More
Credit Photo
If you would like to credit the Photo, here are some ways you can do so
Text Link
photo Link
<span class="text-link">
<span>
<a target="_blank" href=https://pikwizard.com/photo/financial-data-analytics-with-digital-visualization-concept/bb742a83cba03c7d07b9e1a4dc2f9f33/>PikWizard</a>
</span>
</span>
<span class="image-link">
<span
style="margin: 0 0 20px 0; display: inline-block; vertical-align: middle; width: 100%;"
>
<a
target="_blank"
href="https://pikwizard.com/photo/financial-data-analytics-with-digital-visualization-concept/bb742a83cba03c7d07b9e1a4dc2f9f33/"
style="text-decoration: none; font-size: 10px; margin: 0;"
>
<img src="https://pikwizard.com/pw/medium/bb742a83cba03c7d07b9e1a4dc2f9f33.jpg" style="margin: 0; width: 100%;" alt="" />
<p style="font-size: 12px; margin: 0;">PikWizard</p>
</a>
</span>
</span>
Free (free of charge)
Free for personal and commercial use.
Author: Creative Art