
- Home >
- Stock Photos >
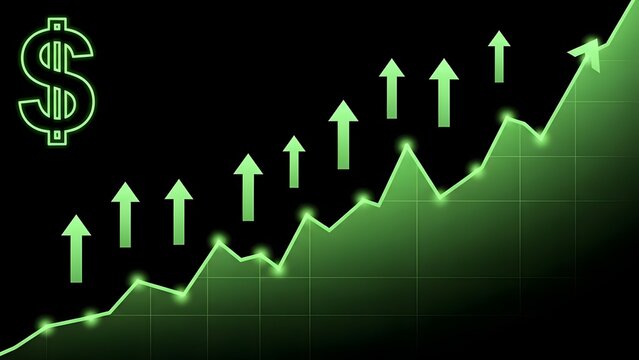
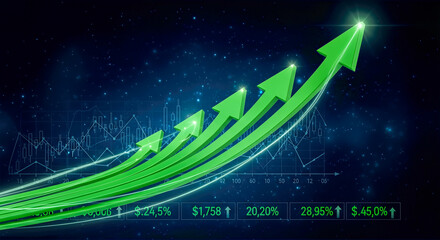
- Financial Data Analytics with Dynamic Green Arrows
Financial Data Analytics with Dynamic Green Arrows Image

Green arrows and financial graphs rising convey concepts of market fluctuations and digital finance. Useful for business presentations, finance blogs, and reports on economic trends.
Powered by 


downloads
Tags:
More
Credit Photo
If you would like to credit the Photo, here are some ways you can do so
Text Link
photo Link
<span class="text-link">
<span>
<a target="_blank" href=https://pikwizard.com/photo/financial-data-analytics-with-dynamic-green-arrows/9ba53eac4c7ff90ef24f318a5b16cb0c/>PikWizard</a>
</span>
</span>
<span class="image-link">
<span
style="margin: 0 0 20px 0; display: inline-block; vertical-align: middle; width: 100%;"
>
<a
target="_blank"
href="https://pikwizard.com/photo/financial-data-analytics-with-dynamic-green-arrows/9ba53eac4c7ff90ef24f318a5b16cb0c/"
style="text-decoration: none; font-size: 10px; margin: 0;"
>
<img src="https://pikwizard.com/pw/medium/9ba53eac4c7ff90ef24f318a5b16cb0c.jpg" style="margin: 0; width: 100%;" alt="" />
<p style="font-size: 12px; margin: 0;">PikWizard</p>
</a>
</span>
</span>
Free (free of charge)
Free for personal and commercial use.
Author: Authentic Images
Similar Free Stock Images

Premium


Premium


Premium


Premium


Premium


Premium


Premium


Premium


Premium


Premium


Premium


Premium

Premium

Premium


Premium

Premium


Premium

Premium


Premium


Premium


Premium


Premium

Premium


Premium


Premium


Explore More Free Stock Images