
- Home >
- Stock Photos >
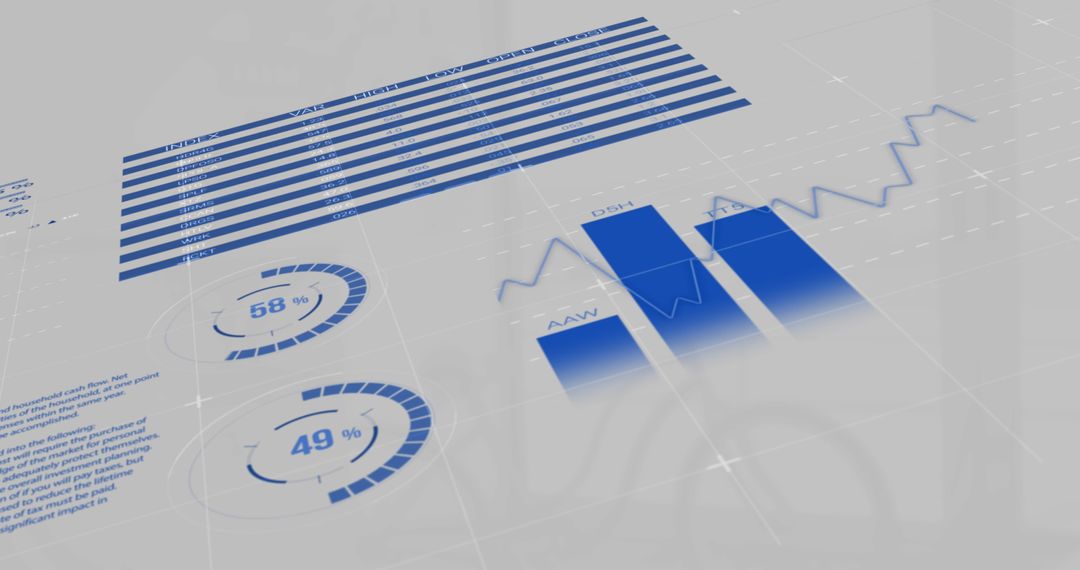
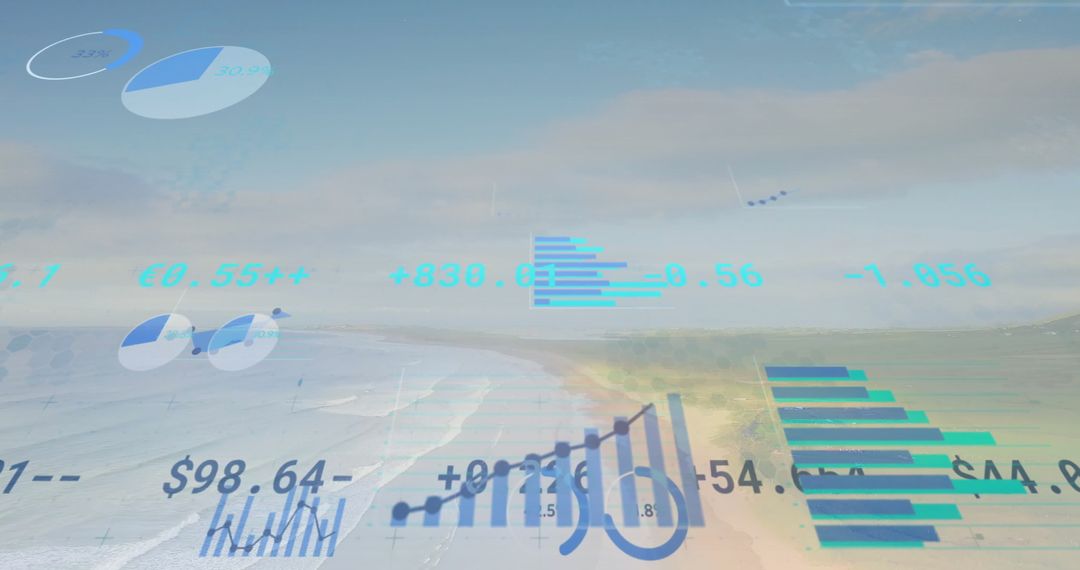
- Financial Data Analytics With Global Market Overlay
Financial Data Analytics With Global Market Overlay Image

Depicting global financial analytics through a mix of charts and graphs over a grid background, this visualization effectively communicates the complex interplay of data interpretation in business contexts. Ideal for finance and economics-related presentations, digital media involving global market trends, investment strategies, or data science topics, as well as infographics illustrating market research or financial strategies.
Powered by 


0
downloads
downloads
Tags:
More
Credit Photo
If you would like to credit the Photo, here are some ways you can do so
Text Link
photo Link
<span class="text-link">
<span>
<a target="_blank" href=https://pikwizard.com/photo/financial-data-analytics-with-global-market-overlay/dac177cbd6e5e78f91ad5c69ea0c8738/>PikWizard</a>
</span>
</span>
<span class="image-link">
<span
style="margin: 0 0 20px 0; display: inline-block; vertical-align: middle; width: 100%;"
>
<a
target="_blank"
href="https://pikwizard.com/photo/financial-data-analytics-with-global-market-overlay/dac177cbd6e5e78f91ad5c69ea0c8738/"
style="text-decoration: none; font-size: 10px; margin: 0;"
>
<img src="https://pikwizard.com/pw/medium/dac177cbd6e5e78f91ad5c69ea0c8738.jpg" style="margin: 0; width: 100%;" alt="" />
<p style="font-size: 12px; margin: 0;">PikWizard</p>
</a>
</span>
</span>
Free (free of charge)
Free for personal and commercial use.
Author: Authentic Images
Similar Free Stock Images

Premium


Premium


Premium


Premium


Premium


Premium


Premium


Premium


Premium


Premium


Premium


Premium


Premium


Premium


Premium


Premium


Premium


Premium


Premium


Premium


Premium


Premium


Premium


Premium

