
- Home >
- Stock Photos >
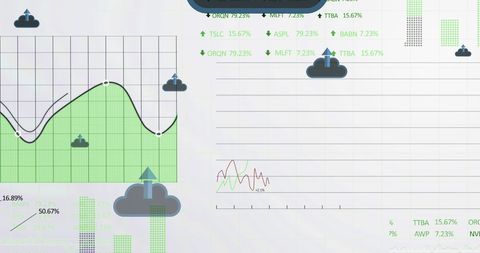
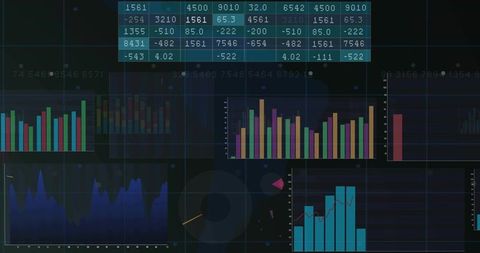
- Financial Data Analytics with Graphs and statistics
Financial Data Analytics with Graphs and statistics Image

This depicts the concept of digital financial analysis with graphs and data. Ideal for illustrating themes of global finance, business intelligence, data science, investment decisions, and corporate strategy development. Useful for websites and articles focused on finance, technology in business, and economic studies.
Powered by 


downloads
Tags:
More
Credit Photo
If you would like to credit the Photo, here are some ways you can do so
Text Link
photo Link
<span class="text-link">
<span>
<a target="_blank" href=https://pikwizard.com/photo/financial-data-analytics-with-graphs-and-statistics/aba14a8a904b809f98b35af73ac5f213/>PikWizard</a>
</span>
</span>
<span class="image-link">
<span
style="margin: 0 0 20px 0; display: inline-block; vertical-align: middle; width: 100%;"
>
<a
target="_blank"
href="https://pikwizard.com/photo/financial-data-analytics-with-graphs-and-statistics/aba14a8a904b809f98b35af73ac5f213/"
style="text-decoration: none; font-size: 10px; margin: 0;"
>
<img src="https://pikwizard.com/pw/medium/aba14a8a904b809f98b35af73ac5f213.jpg" style="margin: 0; width: 100%;" alt="" />
<p style="font-size: 12px; margin: 0;">PikWizard</p>
</a>
</span>
</span>
Free (free of charge)
Free for personal and commercial use.
Author: Authentic Images
Similar Free Stock Images

Premium


Premium


Premium


Premium


Premium

Premium

Premium

Premium

Premium


Premium

Premium

Premium


Premium

Premium


Premium


Premium

Premium


Premium


Premium

Premium


Premium


Premium


Premium


Premium

Premium


Explore More Free Stock Images