
- Home >
- Stock Photos >
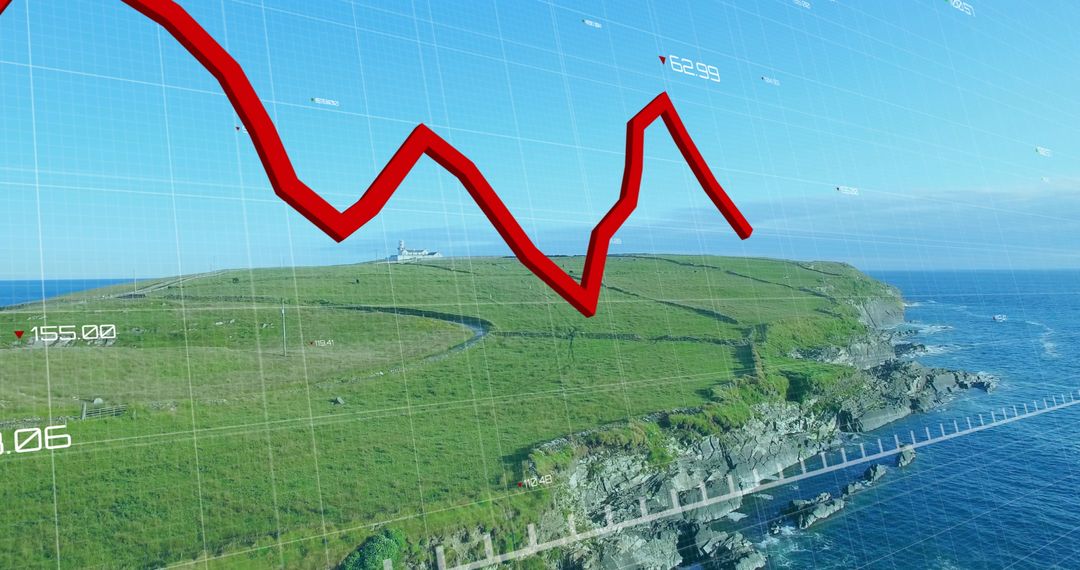
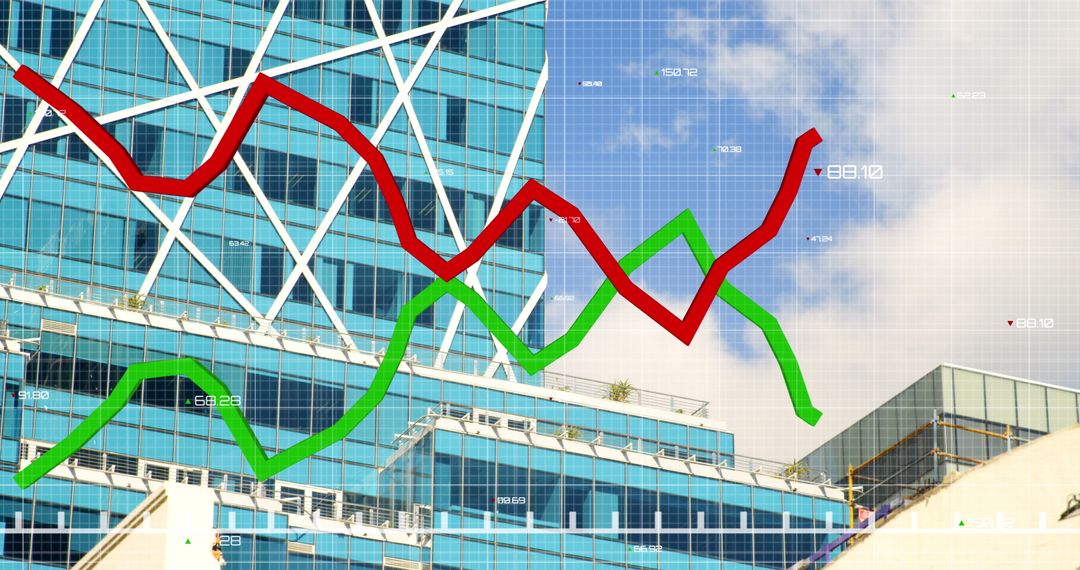
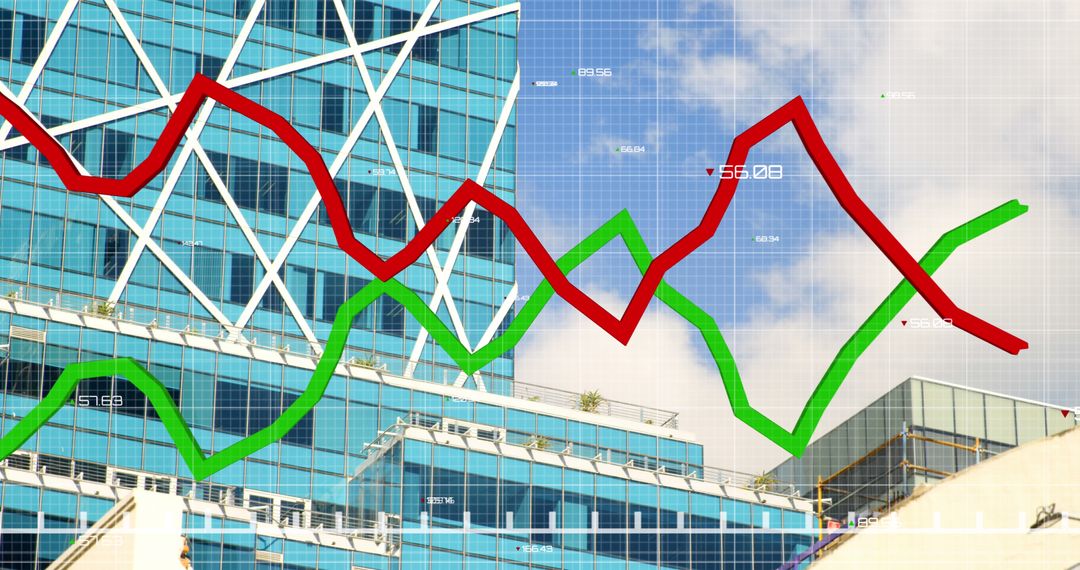
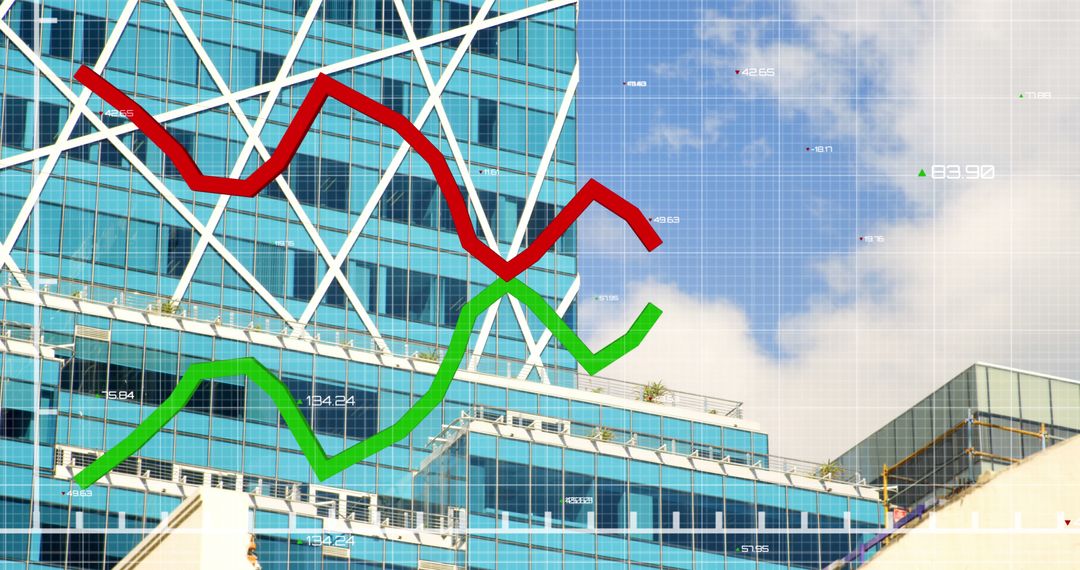
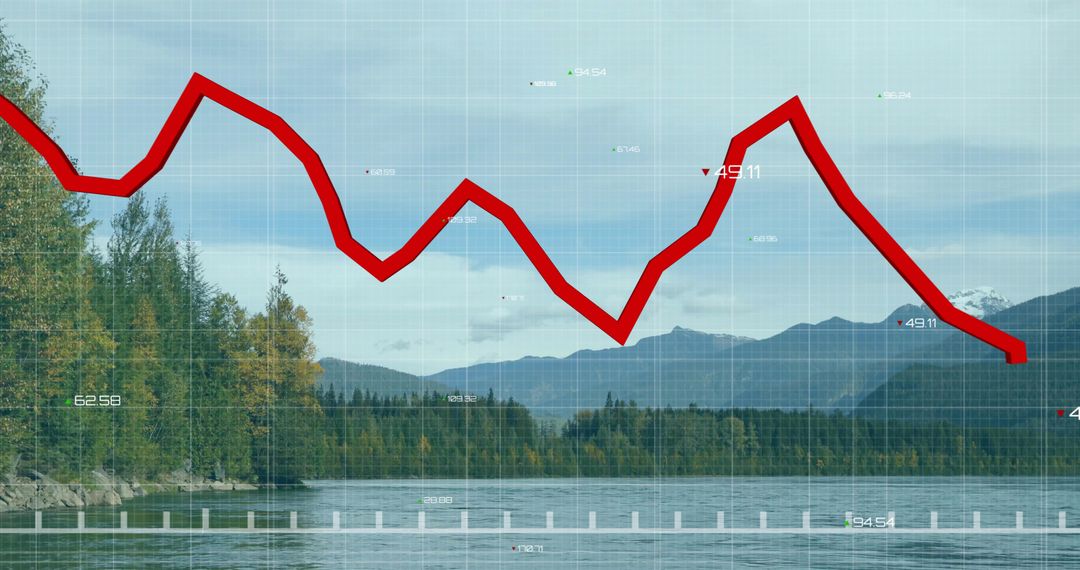
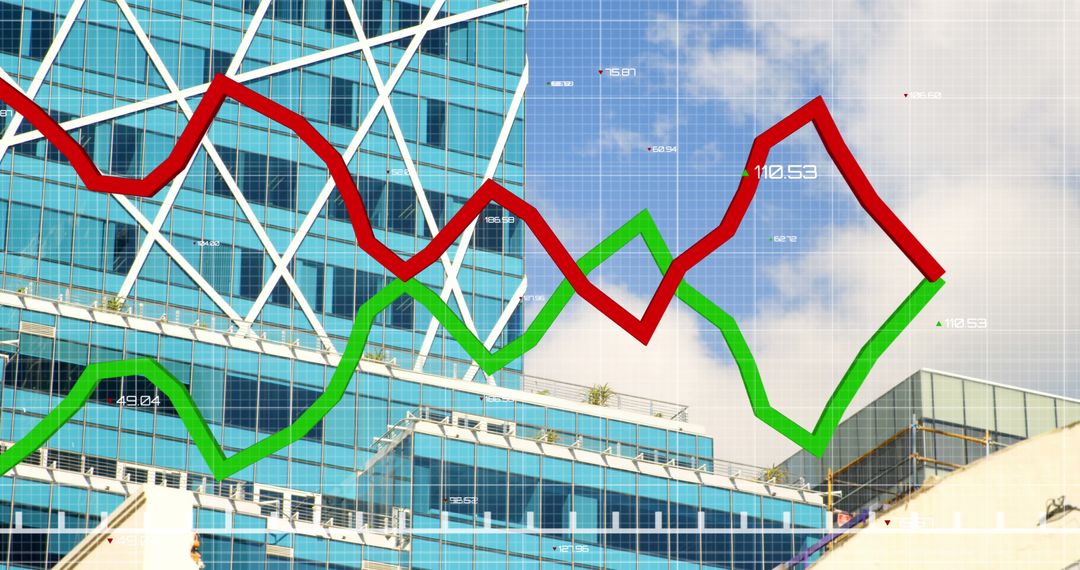
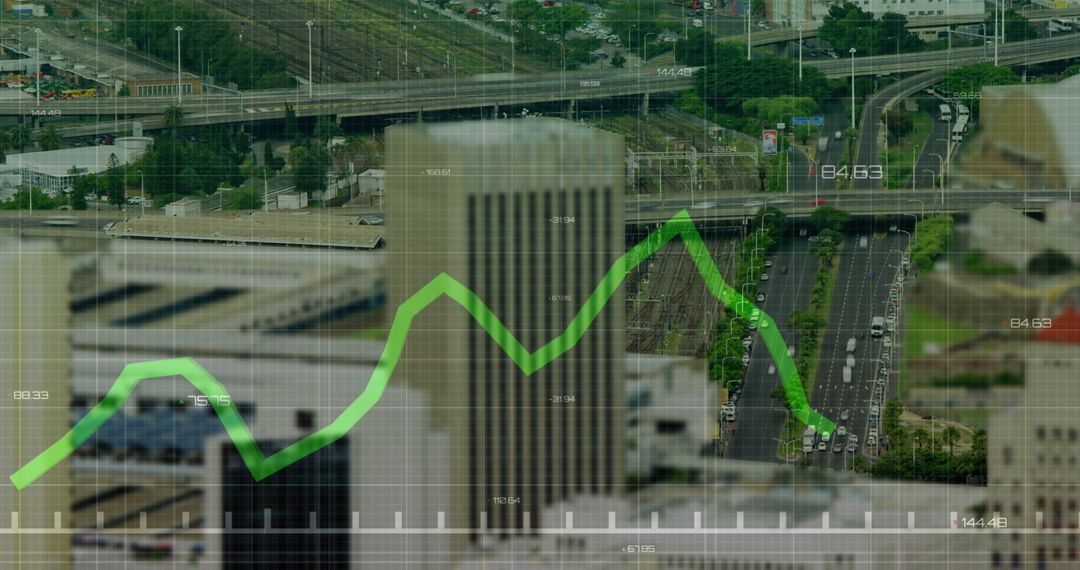
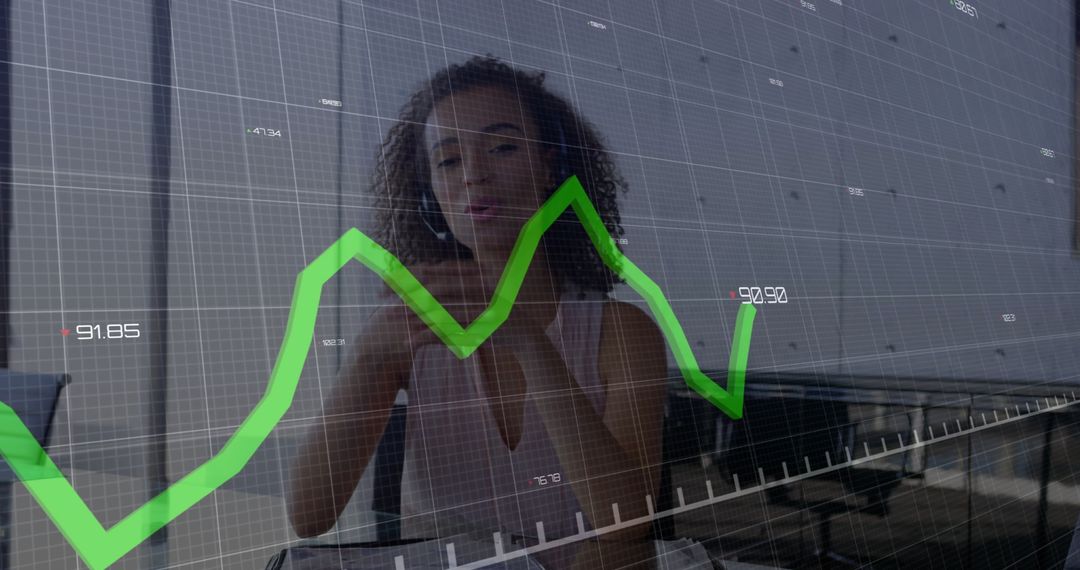
- Financial Data Analytics with Graphs Over Urban Architecture
Financial Data Analytics with Graphs Over Urban Architecture Image
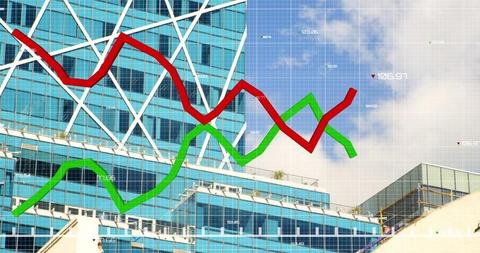
Contemporary urban architecture merging with analytical graphs conveys complex financial concepts. This visual representation of market trends against a modern building can illustrate articles on economic analysis, finance reports, or real estate market dynamics. Suitable for editorial pieces as well as digital financial platforms to depict a progressive integrating urban business and economy.
Powered by 


2
downloads
downloads
Tags:
More
Credit Photo
If you would like to credit the Photo, here are some ways you can do so
Text Link
photo Link
<span class="text-link">
<span>
<a target="_blank" href=https://pikwizard.com/photo/financial-data-analytics-with-graphs-over-urban-architecture/541e225c4184019160291beafcec3238/>PikWizard</a>
</span>
</span>
<span class="image-link">
<span
style="margin: 0 0 20px 0; display: inline-block; vertical-align: middle; width: 100%;"
>
<a
target="_blank"
href="https://pikwizard.com/photo/financial-data-analytics-with-graphs-over-urban-architecture/541e225c4184019160291beafcec3238/"
style="text-decoration: none; font-size: 10px; margin: 0;"
>
<img src="https://pikwizard.com/pw/medium/541e225c4184019160291beafcec3238.jpg" style="margin: 0; width: 100%;" alt="" />
<p style="font-size: 12px; margin: 0;">PikWizard</p>
</a>
</span>
</span>
Free (free of charge)
Free for personal and commercial use.
Author: Authentic Images
Similar Free Stock Images

Premium


Premium


Premium


Premium


Premium


Premium


Premium


Premium


Premium


Premium


Premium


Premium


Premium


Premium


Premium


Premium


Premium


Premium


Premium


Premium


Premium


Premium


Premium


Premium

