- Home >
- Stock Photos >
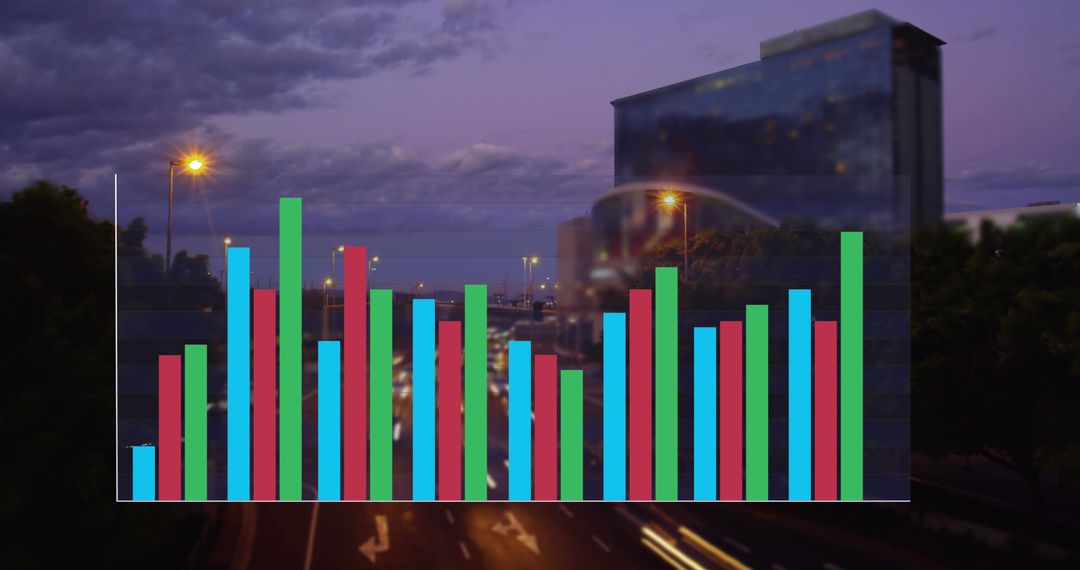
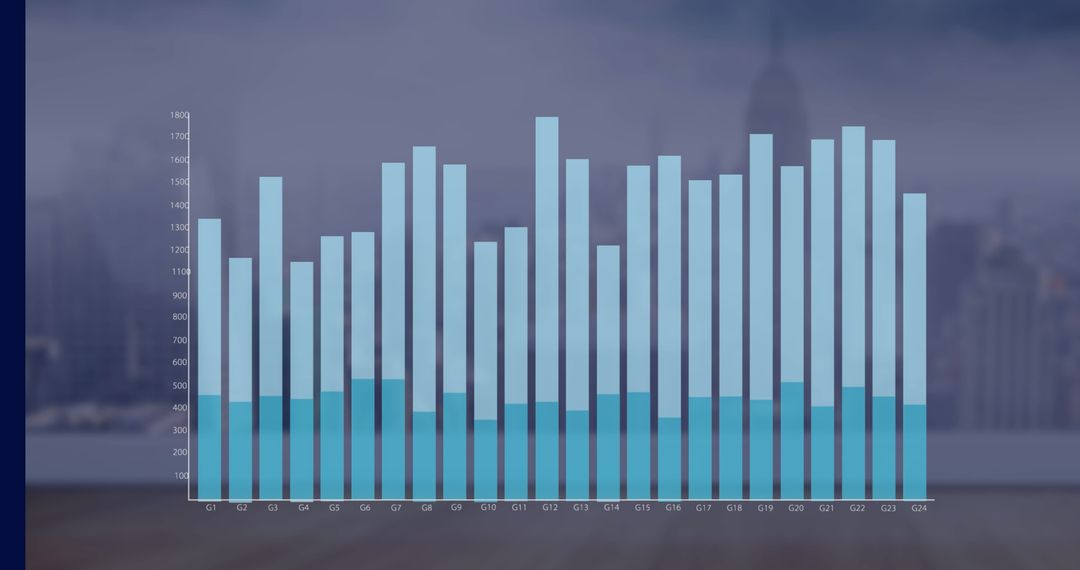
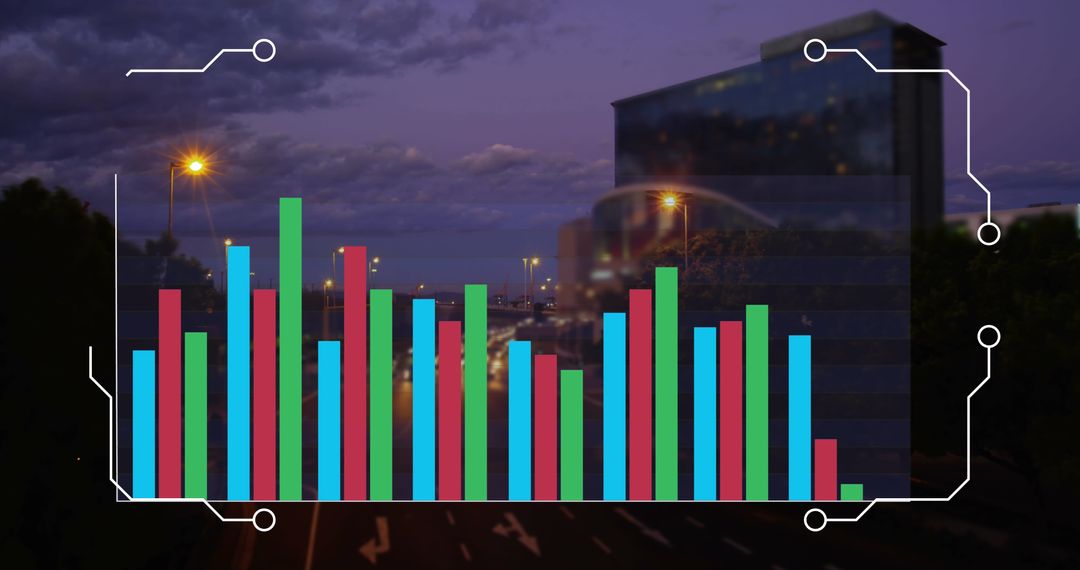
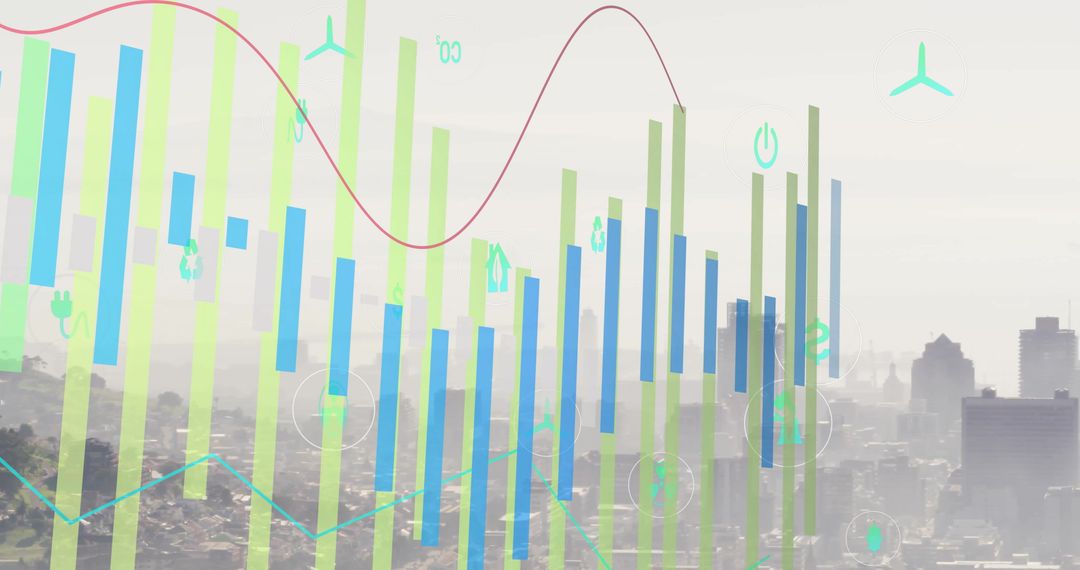
- Financial Data Analytics with Graphs Overlay on Urban Cityscape
Financial Data Analytics with Graphs Overlay on Urban Cityscape Image

Illustration incorporating financial data analytics against backdrop of an urban cityscape. Overlays demonstrate bar and line graphs indicating market trends or economic performance. Suitable for presentations on finance, tech industries, urban development, or client materials visualizing city economy. Reflects advanced technology integration in an urban environment.
Powered by 


4
downloads
downloads
Tags:
More
Credit Photo
If you would like to credit the Photo, here are some ways you can do so
Text Link
photo Link
<span class="text-link">
<span>
<a target="_blank" href=https://pikwizard.com/photo/financial-data-analytics-with-graphs-overlay-on-urban-cityscape/b11a5340d8300b3e15e237dcfeb1228a/>PikWizard</a>
</span>
</span>
<span class="image-link">
<span
style="margin: 0 0 20px 0; display: inline-block; vertical-align: middle; width: 100%;"
>
<a
target="_blank"
href="https://pikwizard.com/photo/financial-data-analytics-with-graphs-overlay-on-urban-cityscape/b11a5340d8300b3e15e237dcfeb1228a/"
style="text-decoration: none; font-size: 10px; margin: 0;"
>
<img src="https://pikwizard.com/pw/medium/b11a5340d8300b3e15e237dcfeb1228a.jpg" style="margin: 0; width: 100%;" alt="" />
<p style="font-size: 12px; margin: 0;">PikWizard</p>
</a>
</span>
</span>
Free (free of charge)
Free for personal and commercial use.
Author: Creative Art
Similar Free Stock Images

Premium


Premium


Premium


Premium


Premium


Premium


Premium


Premium


Premium


Premium


Premium


Premium


Premium


Premium


Premium


Premium


Premium


Premium


Premium


Premium


Premium


Premium


Premium


Premium