
- Home >
- Stock Photos >
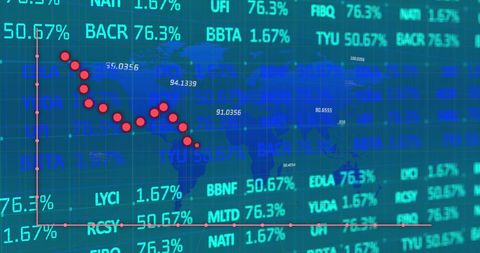
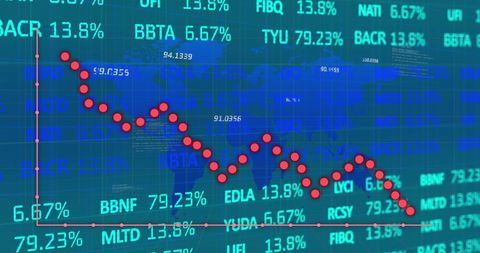
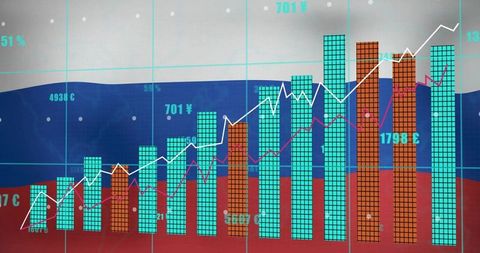
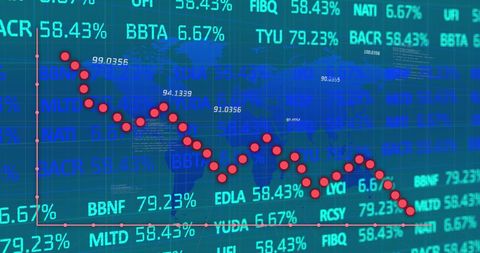
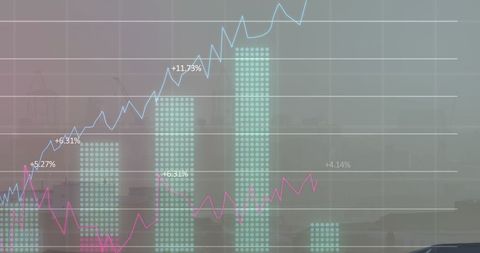
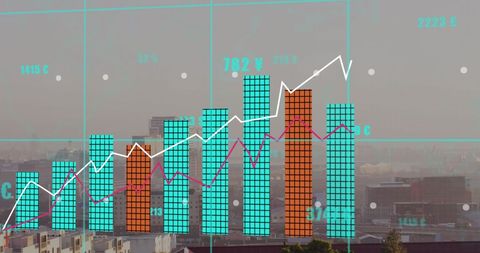
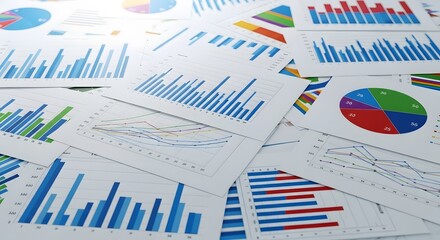
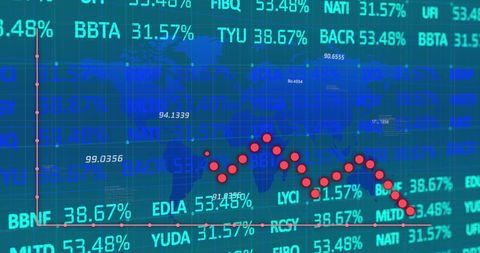
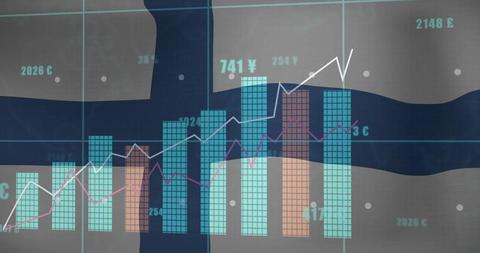
- Financial Data Analytics with Interactive Graphs and Charts
Financial Data Analytics with Interactive Graphs and Charts Image

Depicting various data visualizations, this scene features bar graphs and fluctuating line points showcasing financial metrics. Ideal for illustrating financial reports, presentations on business performance, or educational materials on data analysis and global market trends.
Powered by 


downloads
Tags:
More
Credit Photo
If you would like to credit the Photo, here are some ways you can do so
Text Link
photo Link
<span class="text-link">
<span>
<a target="_blank" href=https://pikwizard.com/photo/financial-data-analytics-with-interactive-graphs-and-charts/dd4f09e74a7960ca6795c134a2b62bcc/>PikWizard</a>
</span>
</span>
<span class="image-link">
<span
style="margin: 0 0 20px 0; display: inline-block; vertical-align: middle; width: 100%;"
>
<a
target="_blank"
href="https://pikwizard.com/photo/financial-data-analytics-with-interactive-graphs-and-charts/dd4f09e74a7960ca6795c134a2b62bcc/"
style="text-decoration: none; font-size: 10px; margin: 0;"
>
<img src="https://pikwizard.com/pw/medium/dd4f09e74a7960ca6795c134a2b62bcc.jpg" style="margin: 0; width: 100%;" alt="" />
<p style="font-size: 12px; margin: 0;">PikWizard</p>
</a>
</span>
</span>
Free (free of charge)
Free for personal and commercial use.
Author: Authentic Images
Similar Free Stock Images

Premium


Premium


Premium


Premium


Premium


Premium


Premium


Premium

Premium

Premium


Premium


Premium


Premium


Premium


Premium


Premium


Premium


Premium


Premium


Premium


Premium


Premium

Premium


Premium


Premium

Explore More Free Stock Images