- Home >
- Stock Photos >
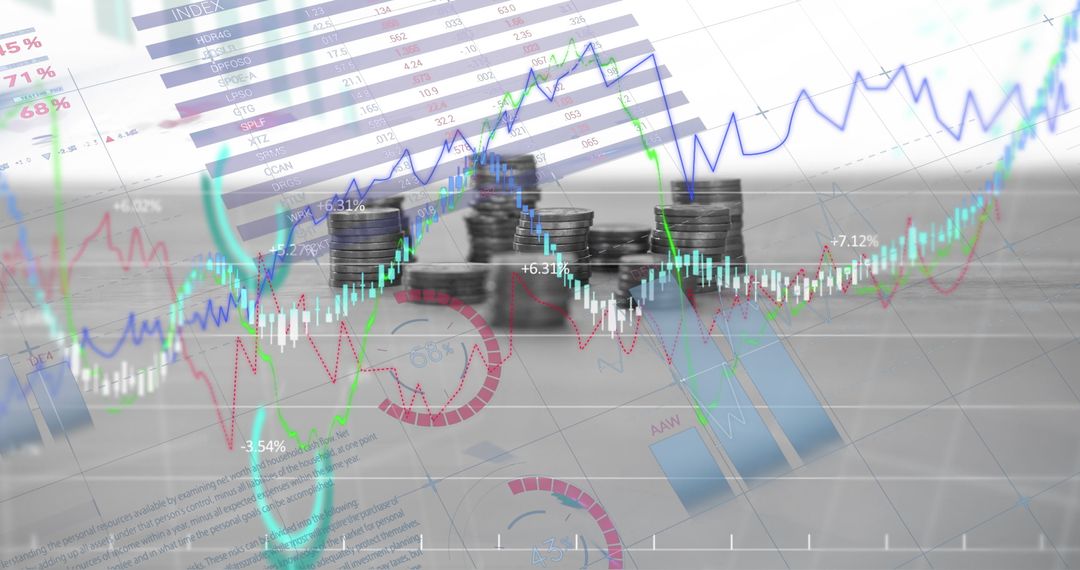
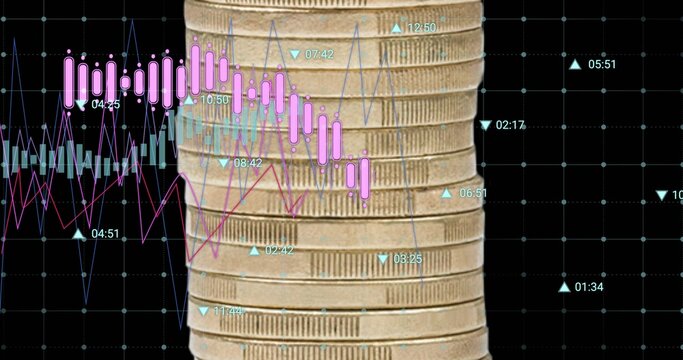
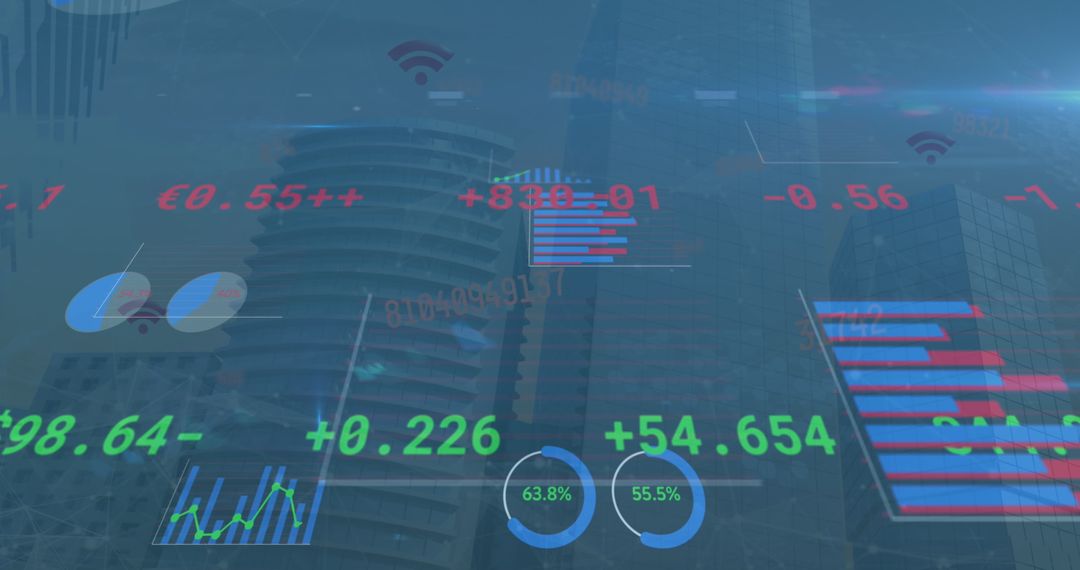
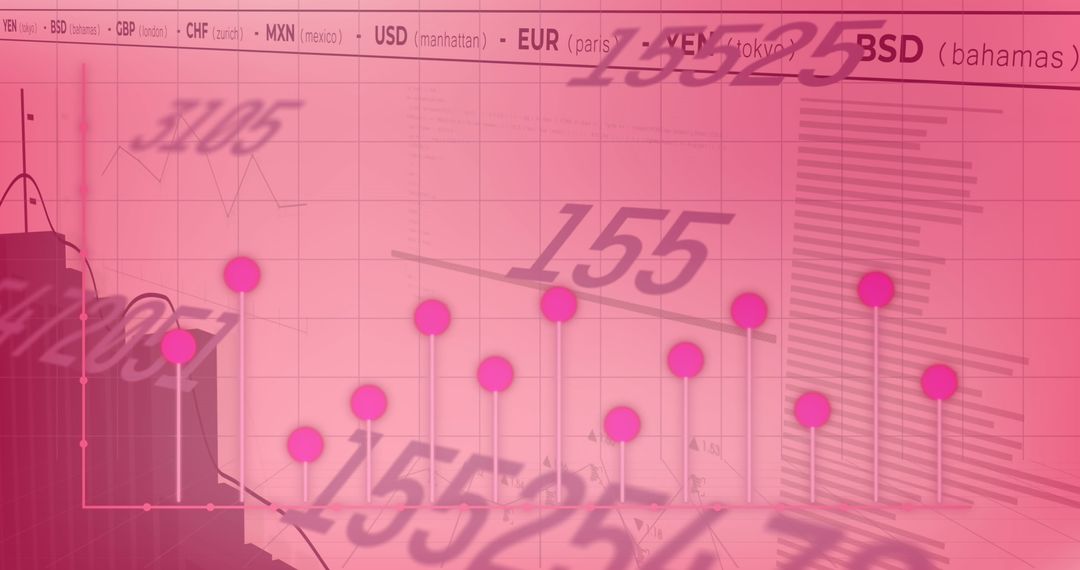
- Financial Data Analytics with Stacked Coins and Digital Graphs
Financial Data Analytics with Stacked Coins and Digital Graphs Image

Depicts the dynamic relationship between financial data and economic growth through digital graphs overlaying stacks of coins. Ideal for illustrating topics related to fintech, investment strategies, economic analysis, or global business trends in presentations, articles, or advertisements.
Powered by 


0
downloads
downloads
Tags:
More
Credit Photo
If you would like to credit the Photo, here are some ways you can do so
Text Link
photo Link
<span class="text-link">
<span>
<a target="_blank" href=https://pikwizard.com/photo/financial-data-analytics-with-stacked-coins-and-digital-graphs/c891c3b9b9a35aad6f4649669cb4b3ec/>PikWizard</a>
</span>
</span>
<span class="image-link">
<span
style="margin: 0 0 20px 0; display: inline-block; vertical-align: middle; width: 100%;"
>
<a
target="_blank"
href="https://pikwizard.com/photo/financial-data-analytics-with-stacked-coins-and-digital-graphs/c891c3b9b9a35aad6f4649669cb4b3ec/"
style="text-decoration: none; font-size: 10px; margin: 0;"
>
<img src="https://pikwizard.com/pw/medium/c891c3b9b9a35aad6f4649669cb4b3ec.jpg" style="margin: 0; width: 100%;" alt="" />
<p style="font-size: 12px; margin: 0;">PikWizard</p>
</a>
</span>
</span>
Free (free of charge)
Free for personal and commercial use.
Author: Awesome Content
Similar Free Stock Images
Premium


Premium


Premium


Premium


Premium


Premium


Premium


Premium


Premium


Premium


Premium


Premium


Premium


Premium


Premium


Premium


Premium


Premium


Premium


Premium


Premium


Premium


Premium


Premium