
- Home >
- Stock Photos >
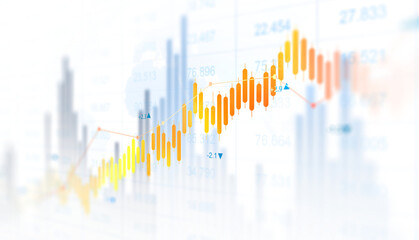
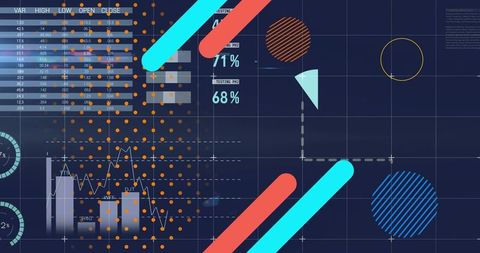
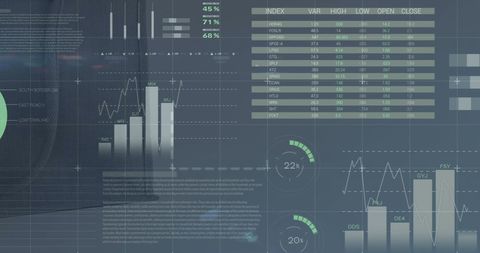
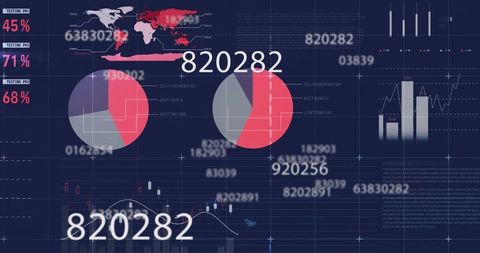
- Financial Data Analytics with Virtual Graphs and Charts
Financial Data Analytics with Virtual Graphs and Charts Image

Digital interface displaying financial data analytics on screen features charts, graphs, and percentages related to stock market trends. Ideal for representing themes related to financial analysis, technological advancements in data processing, or innovative digital business solutions. Suitable for business report layouts, stock market presentations, or technology-focused networking strategy promotions.
Powered by 


downloads
Tags:
More
Credit Photo
If you would like to credit the Photo, here are some ways you can do so
Text Link
photo Link
<span class="text-link">
<span>
<a target="_blank" href=https://pikwizard.com/photo/financial-data-analytics-with-virtual-graphs-and-charts/0a79e69e0c31ce0bbe68adb82eecdece/>PikWizard</a>
</span>
</span>
<span class="image-link">
<span
style="margin: 0 0 20px 0; display: inline-block; vertical-align: middle; width: 100%;"
>
<a
target="_blank"
href="https://pikwizard.com/photo/financial-data-analytics-with-virtual-graphs-and-charts/0a79e69e0c31ce0bbe68adb82eecdece/"
style="text-decoration: none; font-size: 10px; margin: 0;"
>
<img src="https://pikwizard.com/pw/medium/0a79e69e0c31ce0bbe68adb82eecdece.jpg" style="margin: 0; width: 100%;" alt="" />
<p style="font-size: 12px; margin: 0;">PikWizard</p>
</a>
</span>
</span>
Free (free of charge)
Free for personal and commercial use.
Author: People Creations
Similar Free Stock Images

Premium


Premium


Premium


Premium


Premium


Premium


Premium


Premium


Premium


Premium


Premium


Premium

Premium

Premium


Premium


Premium


Premium


Premium

Premium


Premium

Premium


Premium


Premium


Premium

Premium


Explore More Free Stock Images