1. Home > 
  2. Stock Photos > 
  3. Financial Data and Analytics Display Over Cityscape Background

Financial Data and Analytics Display Over Cityscape Background Image

Financial Data and Analytics Display Over Cityscape Background

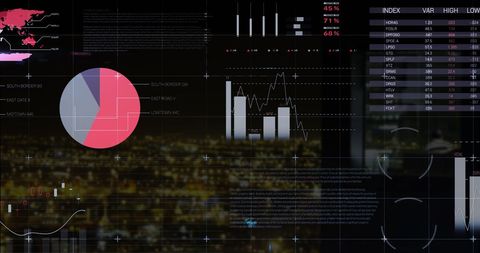
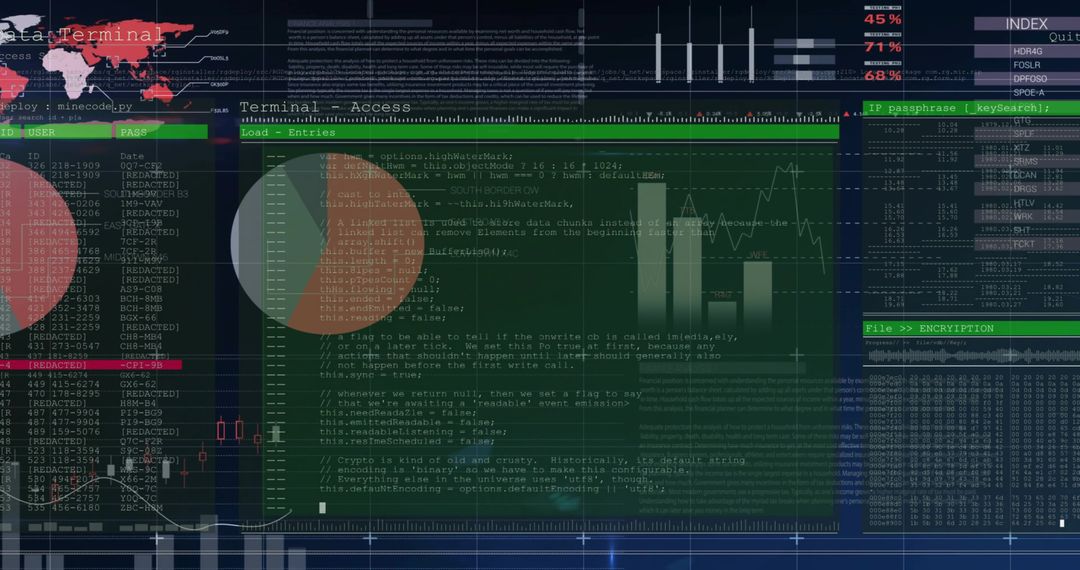
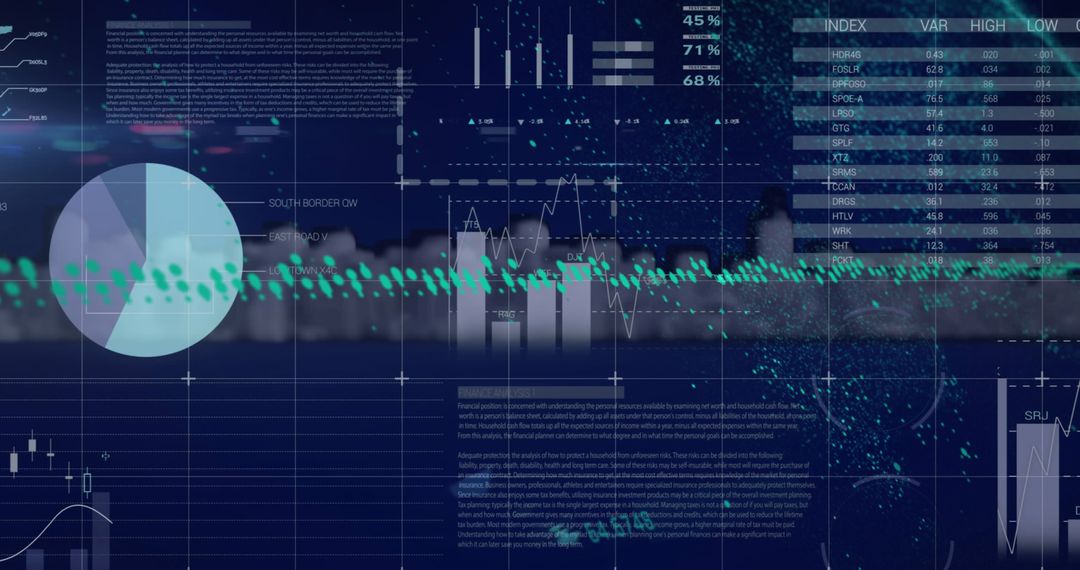
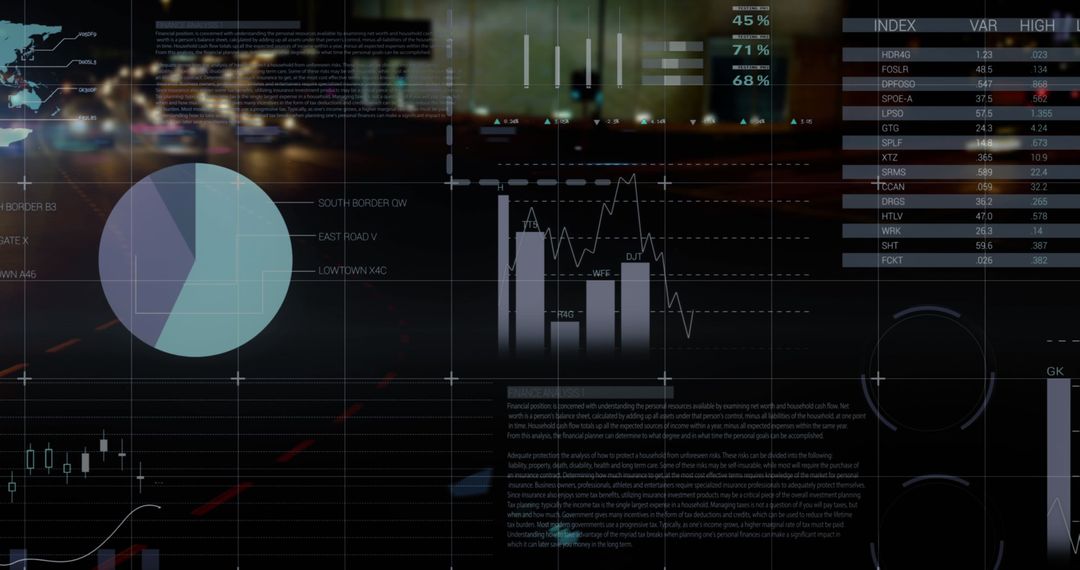
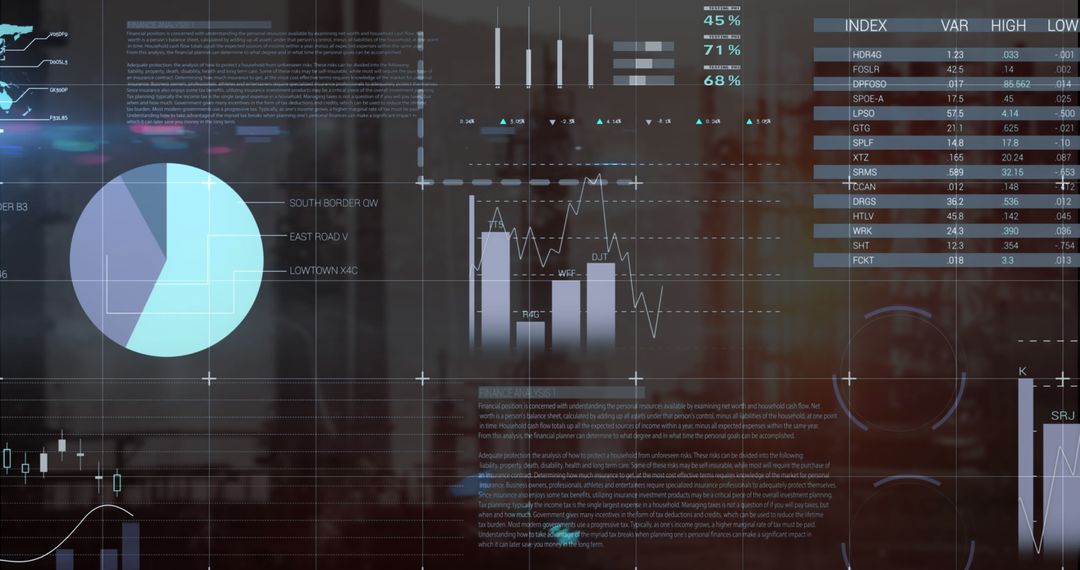
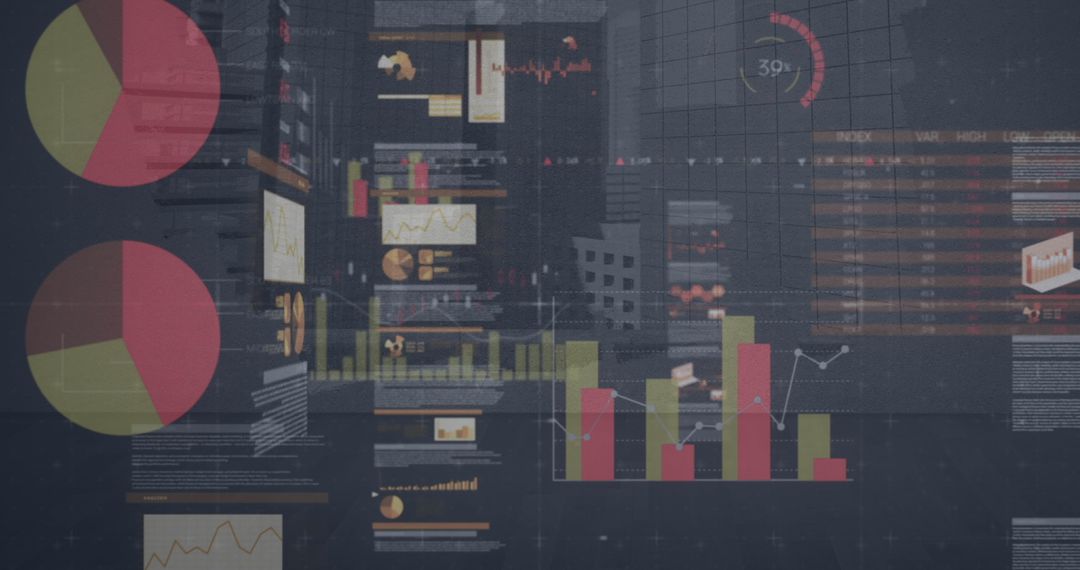
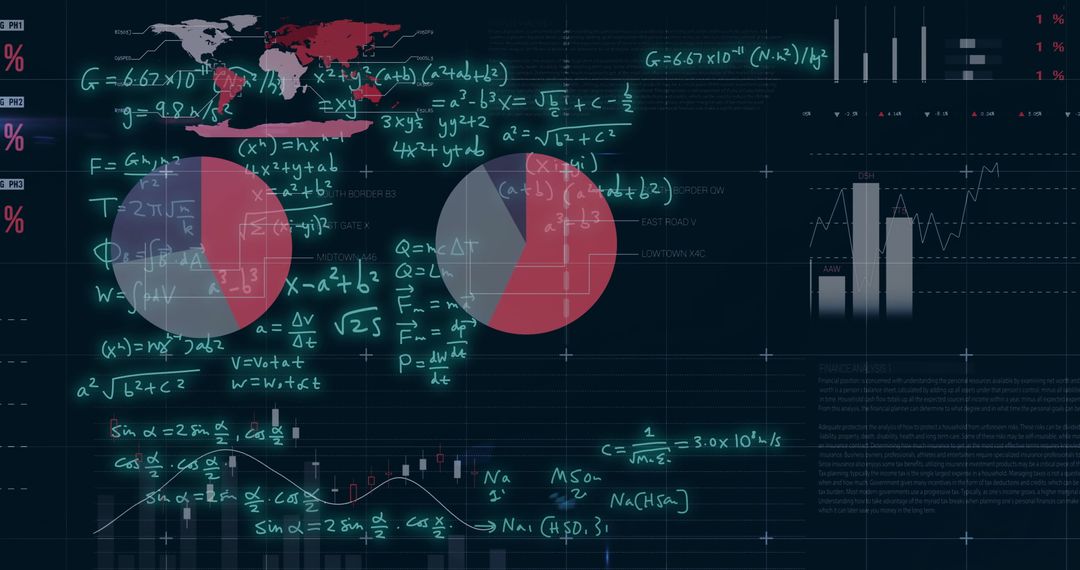
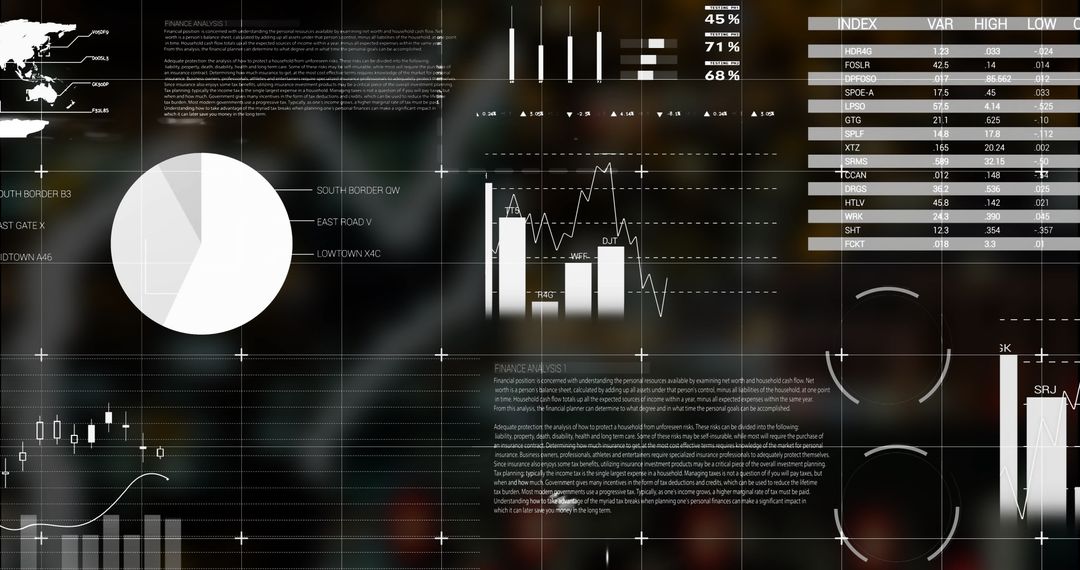
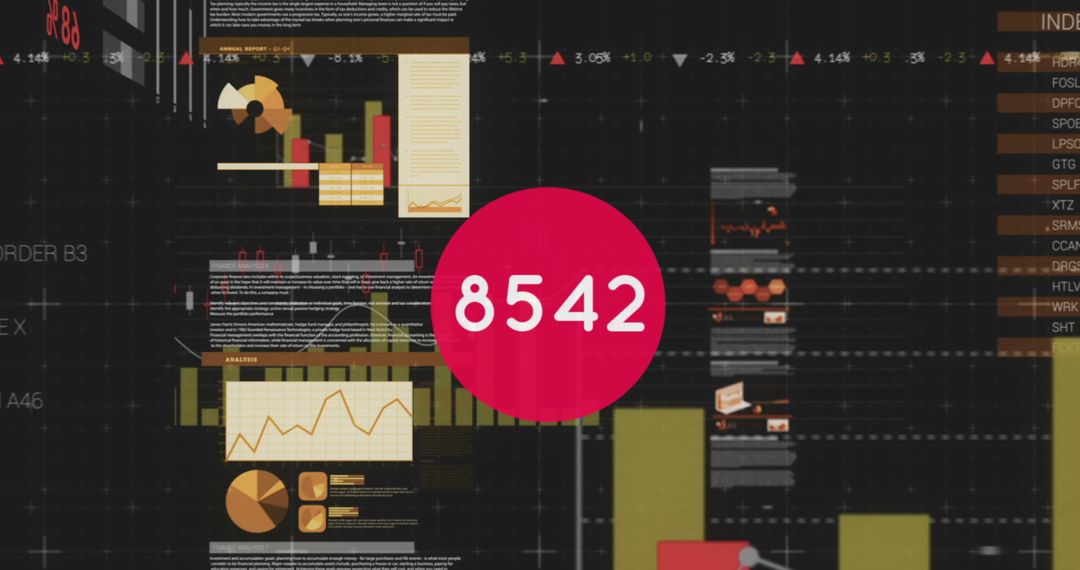
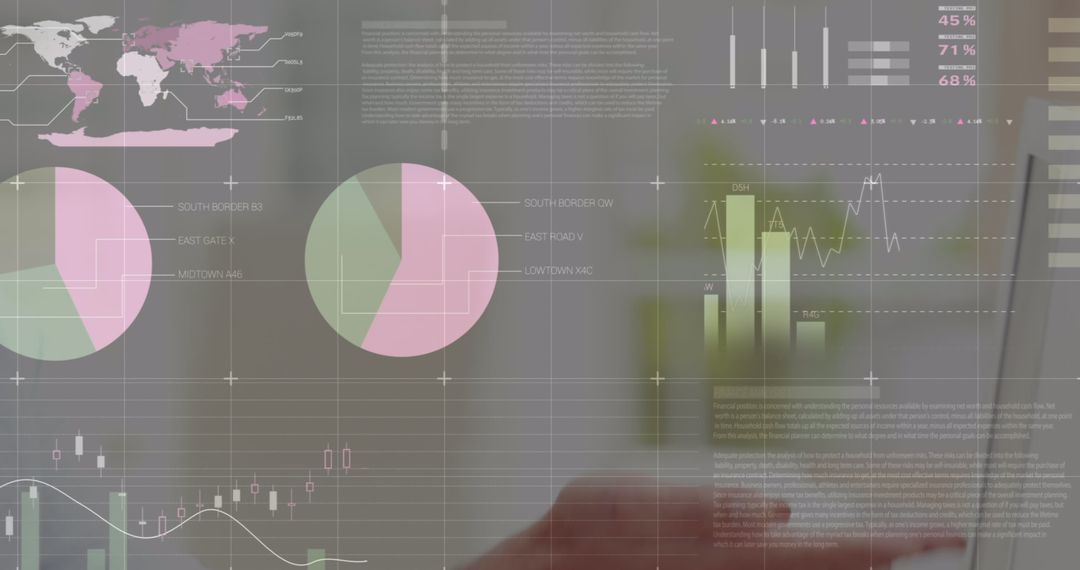
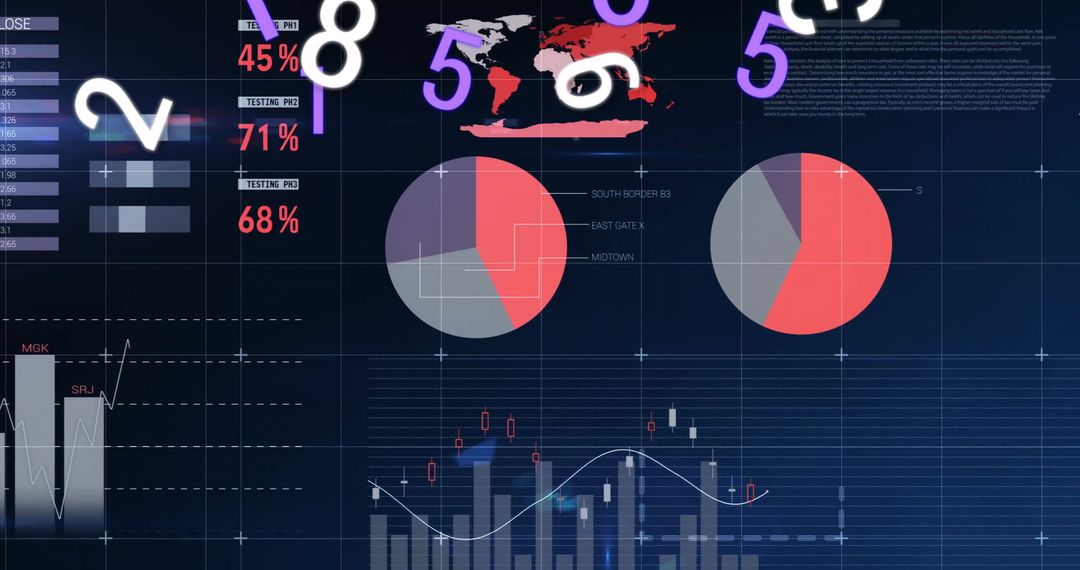
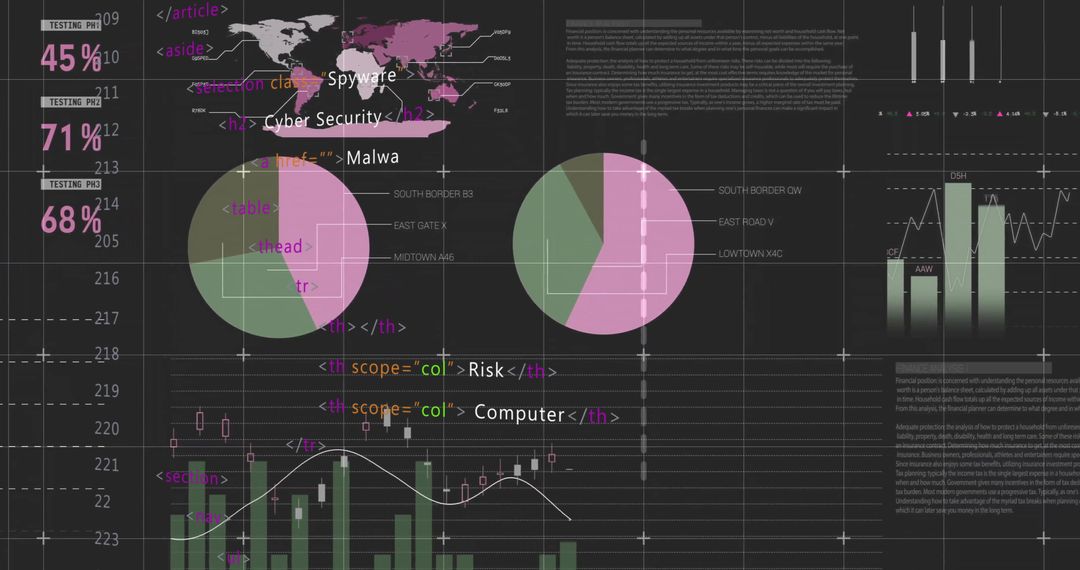
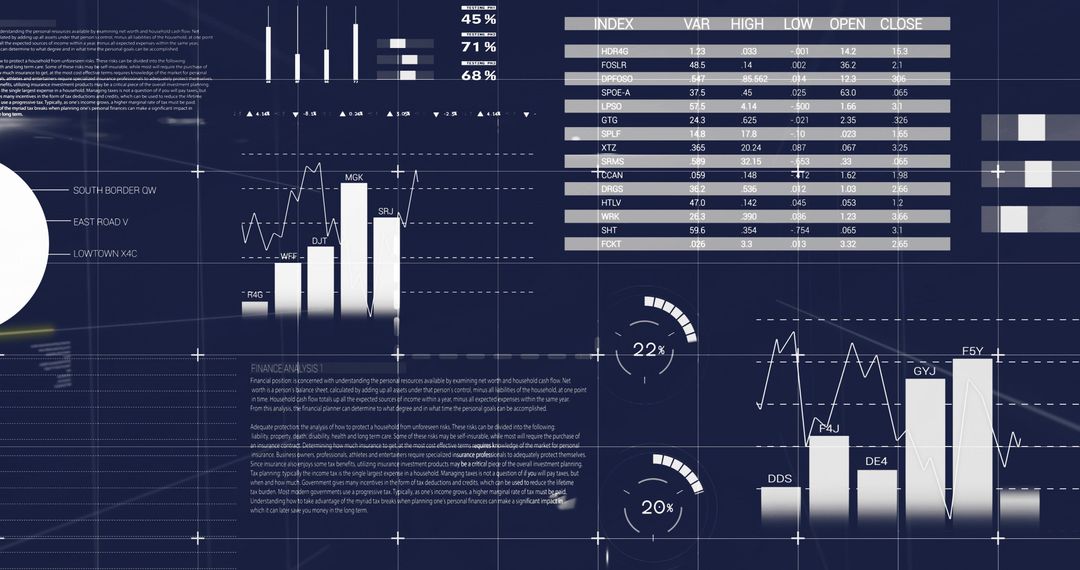
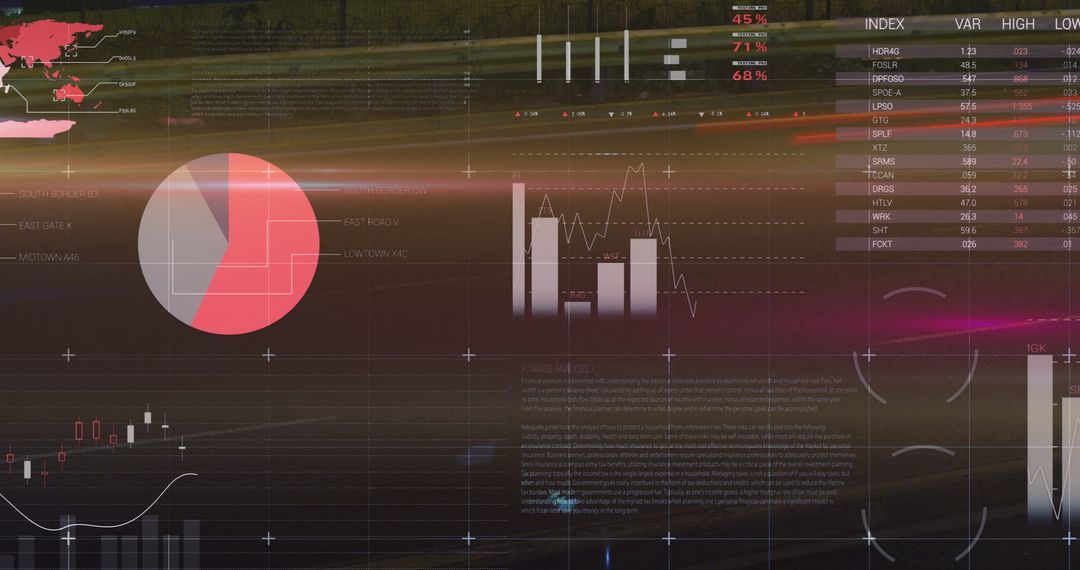
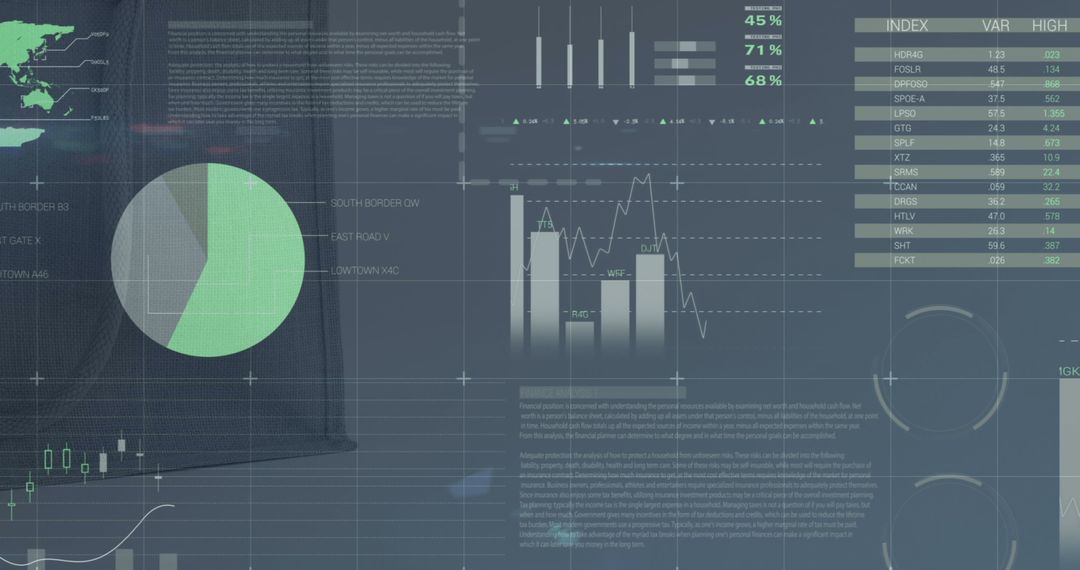
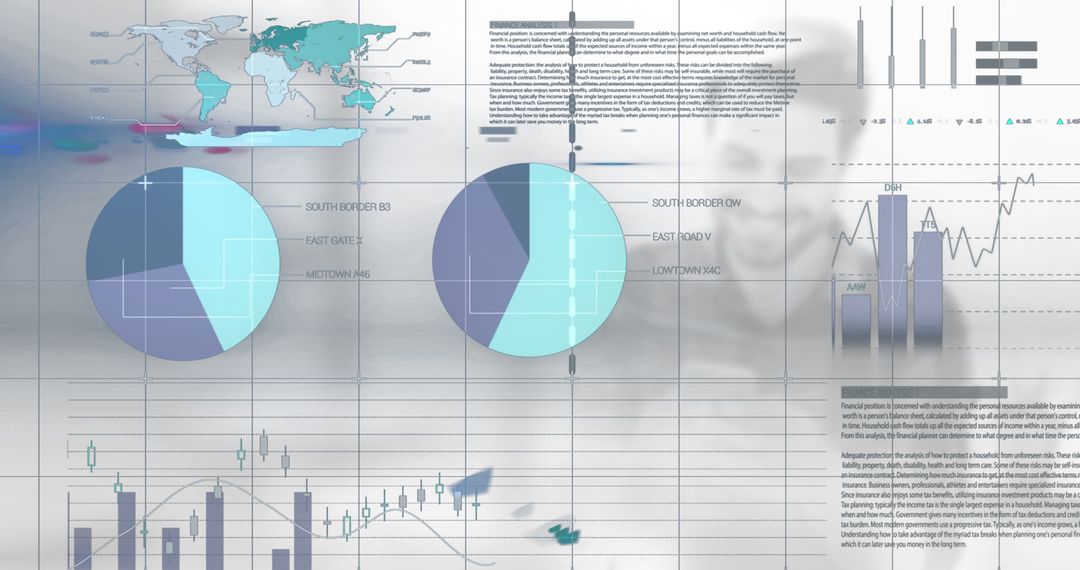
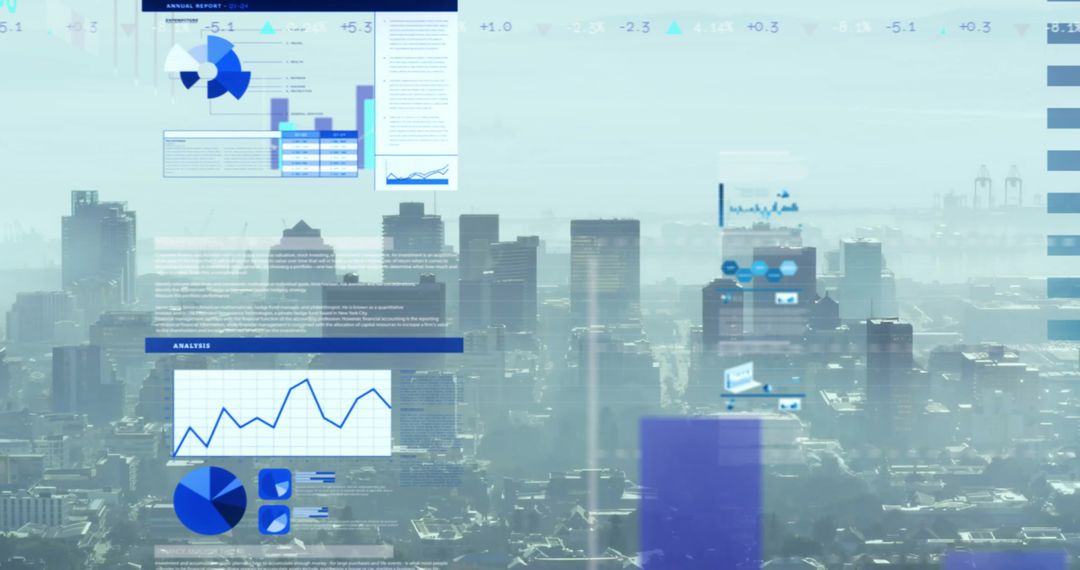
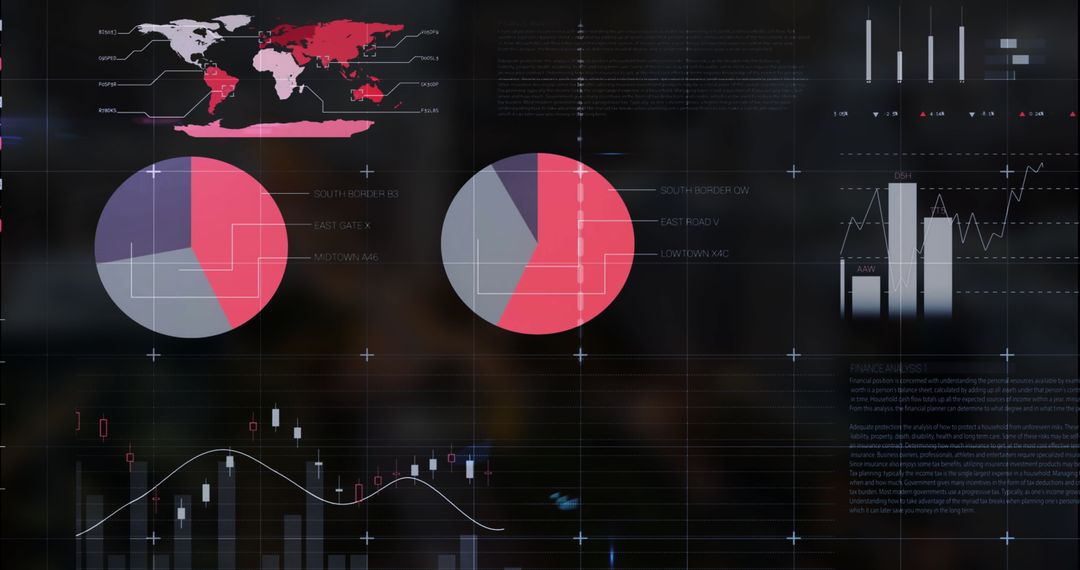
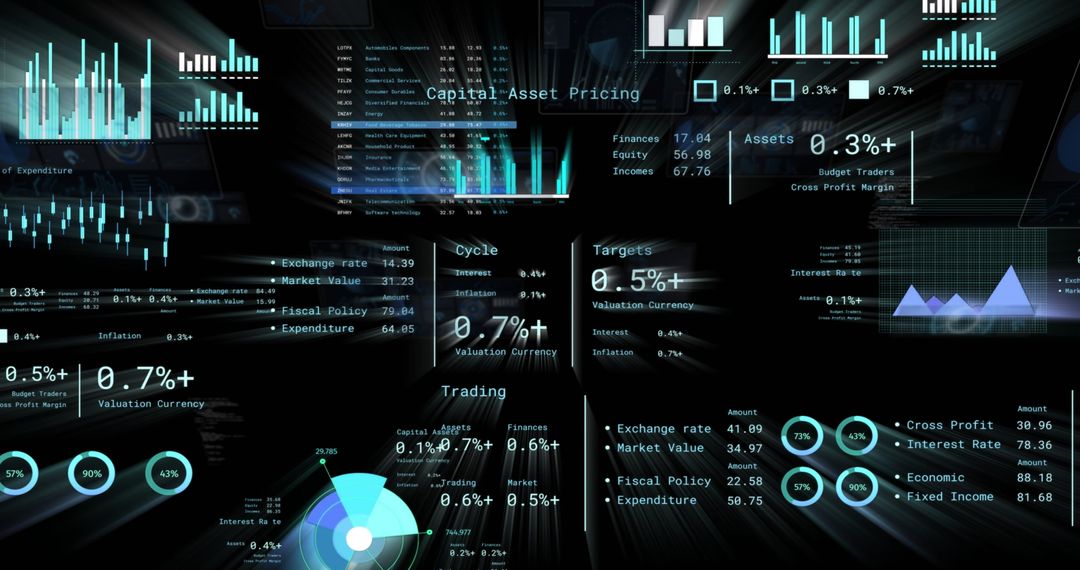
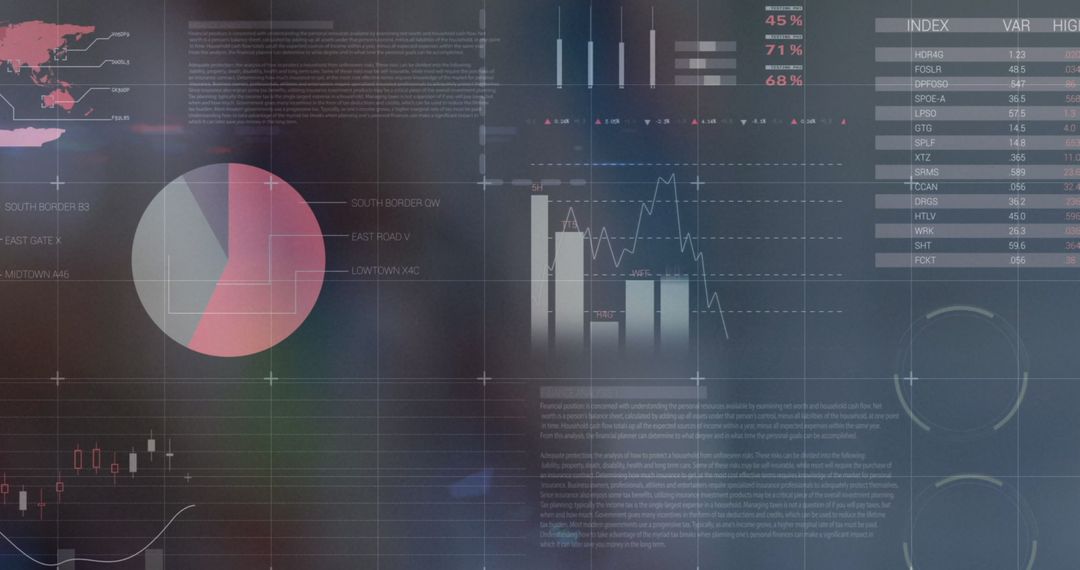
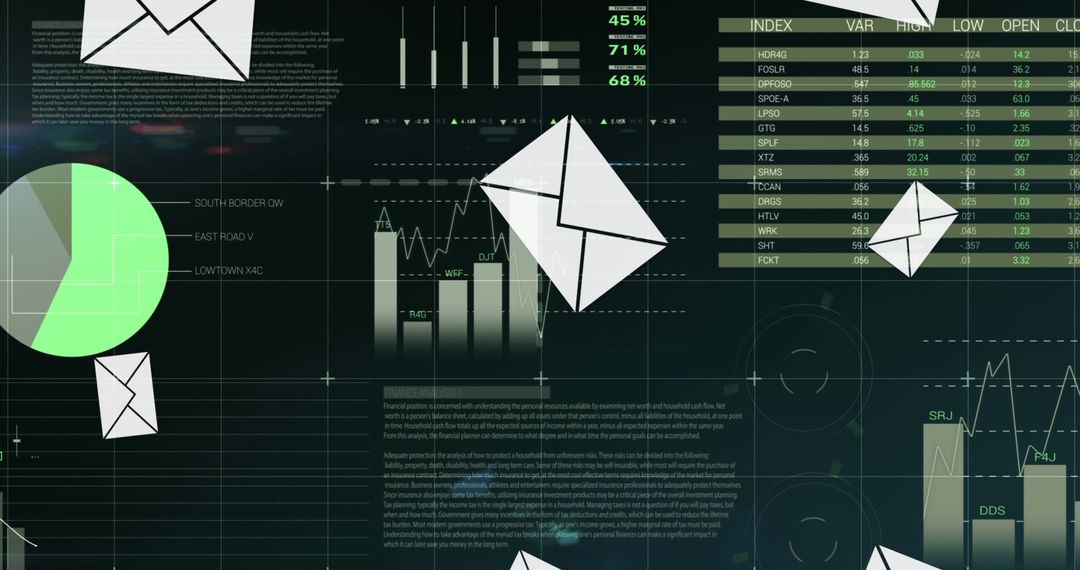
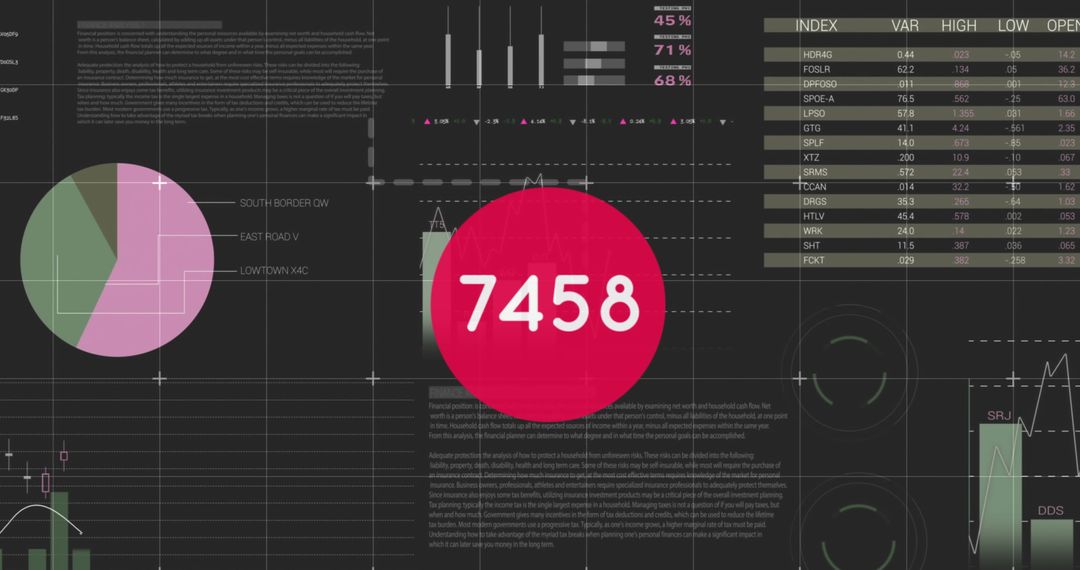
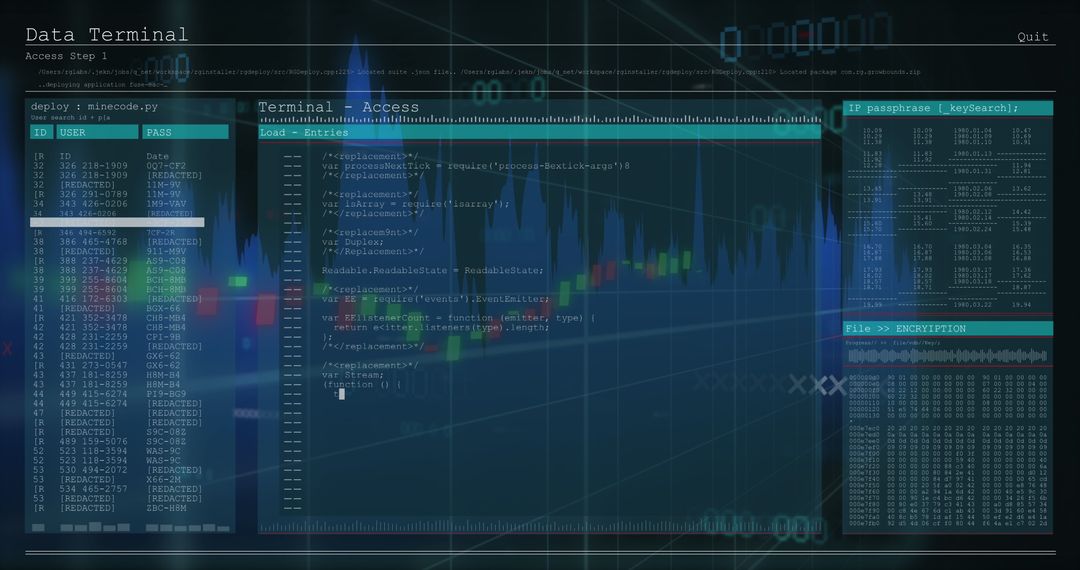
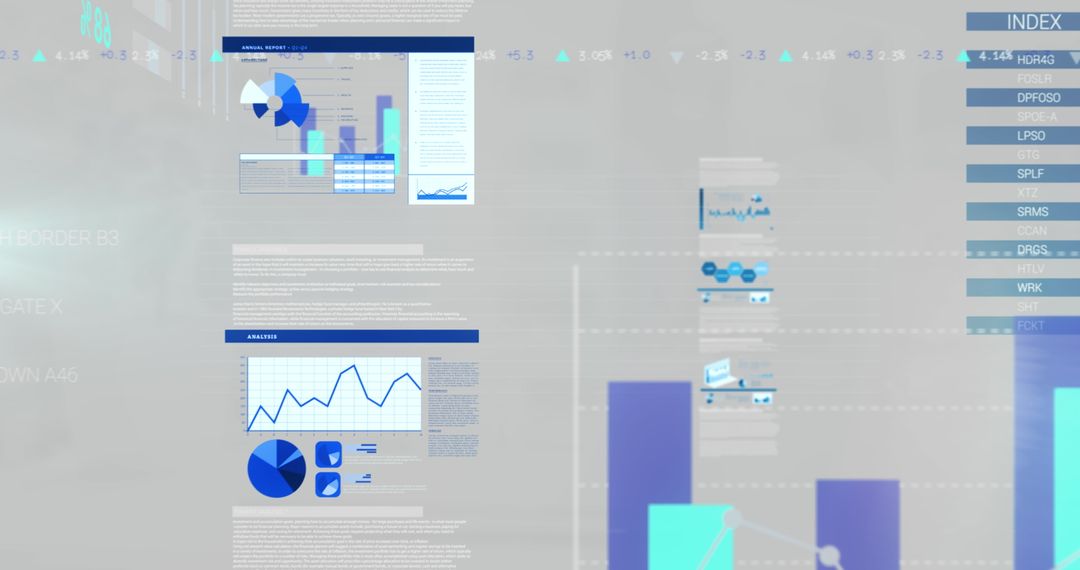
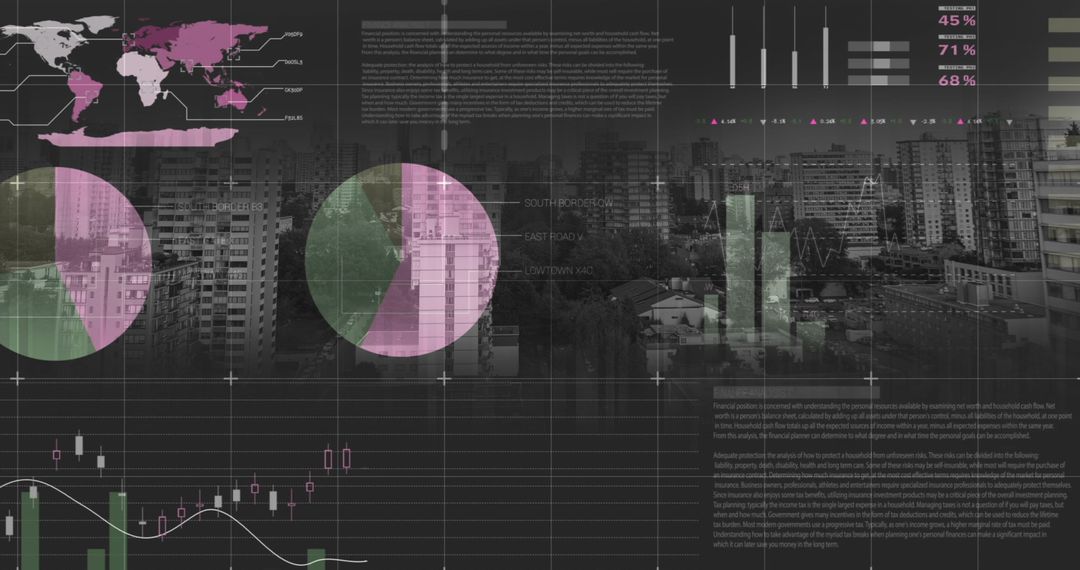
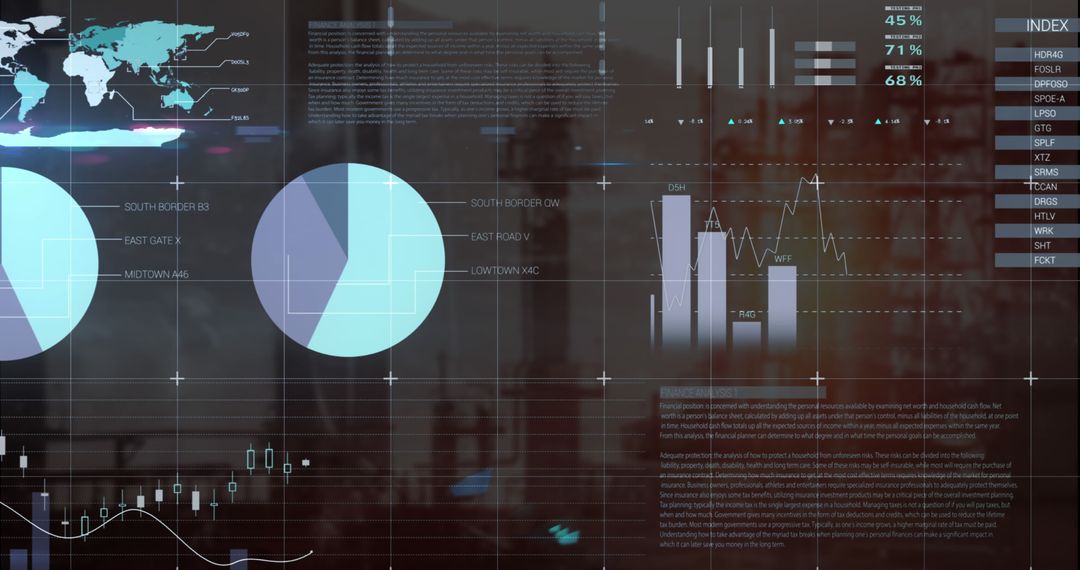
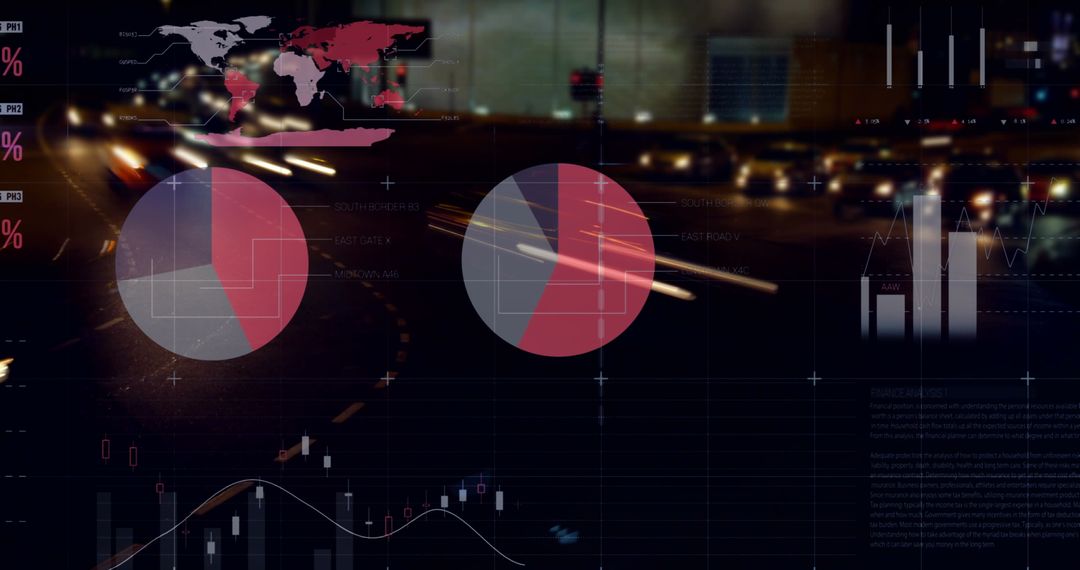
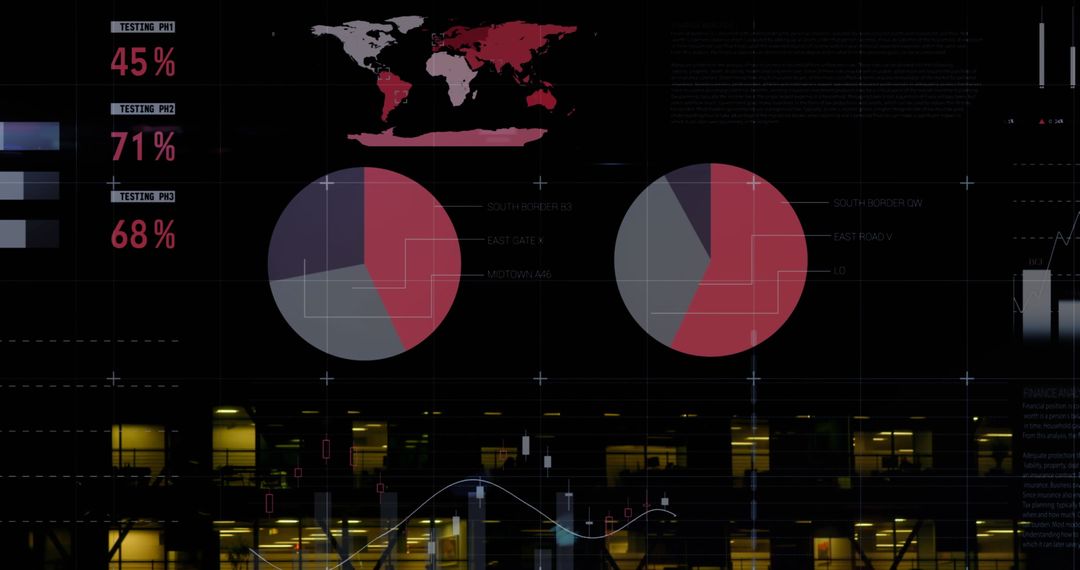
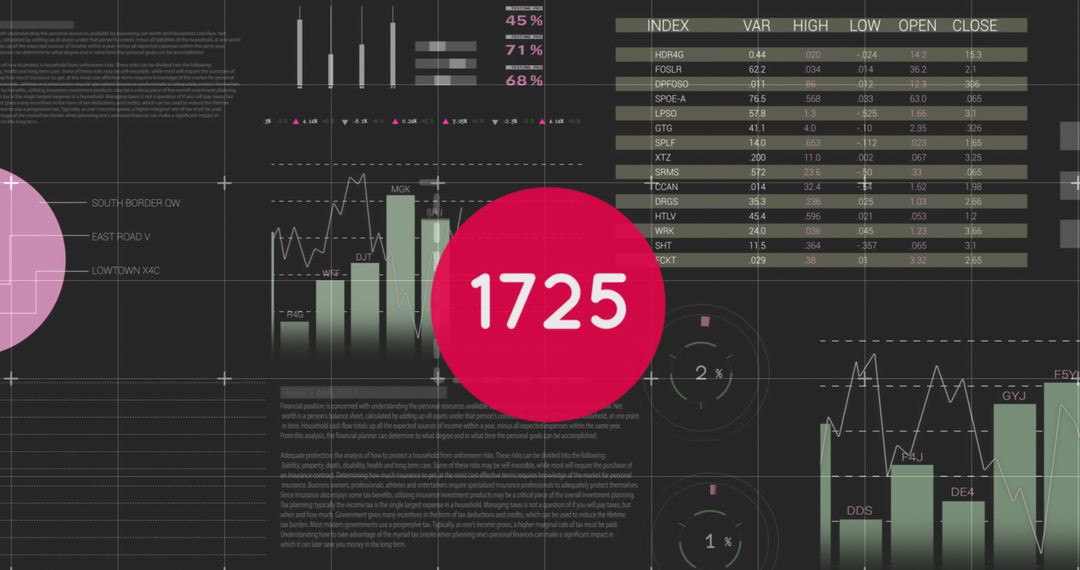
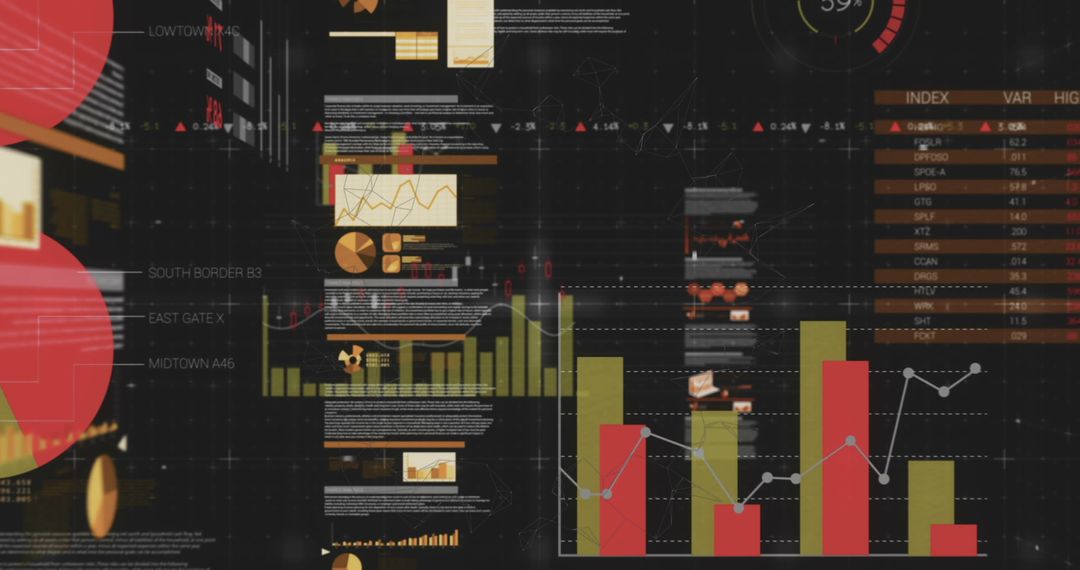
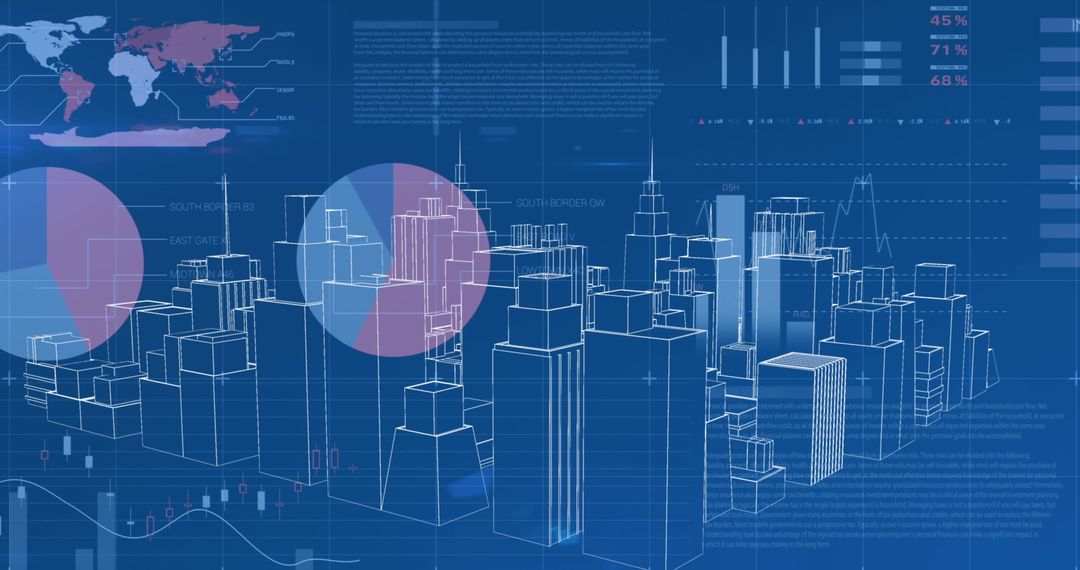
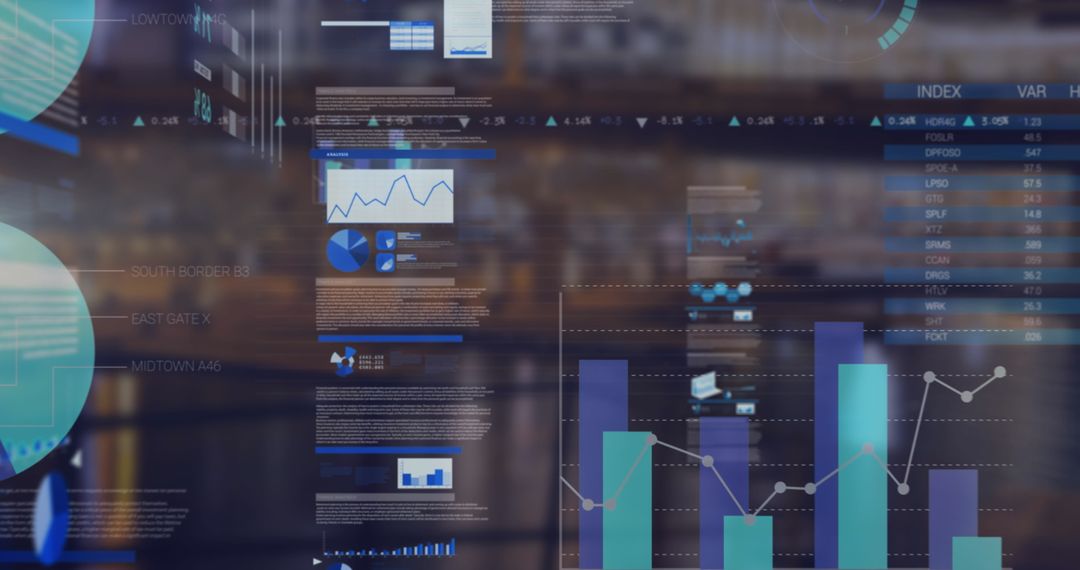
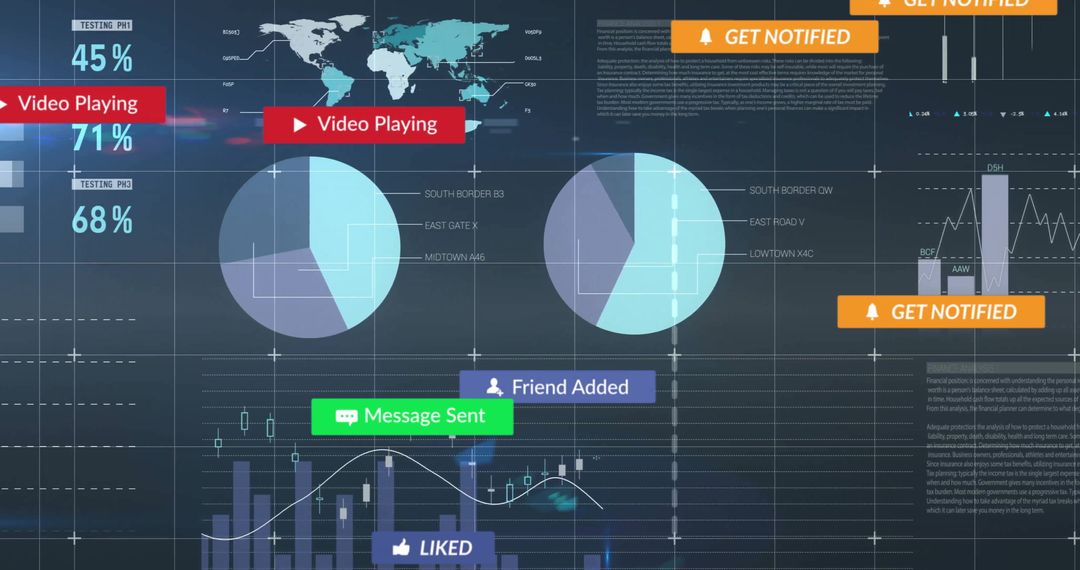
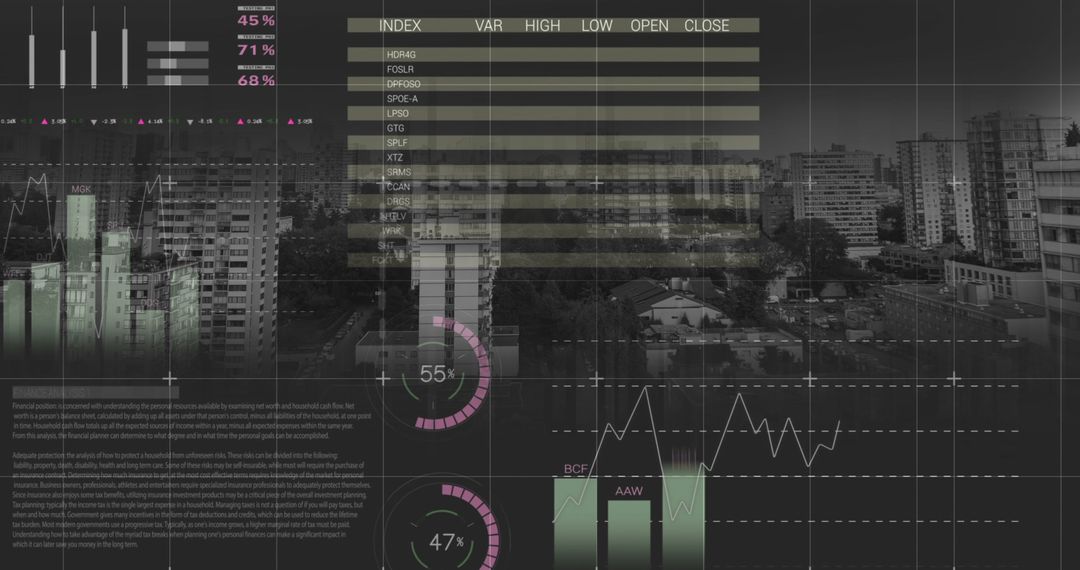
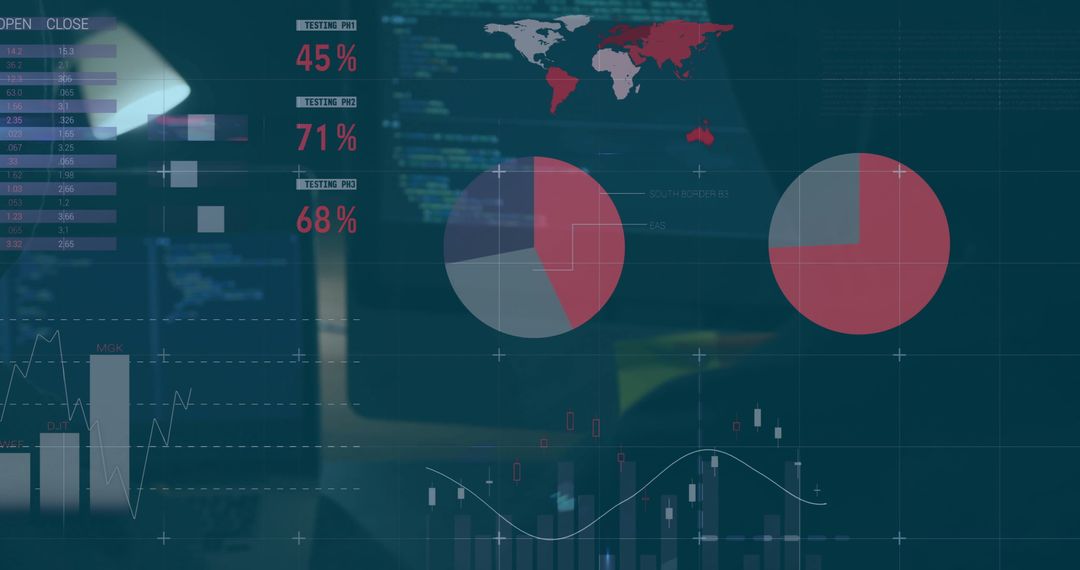
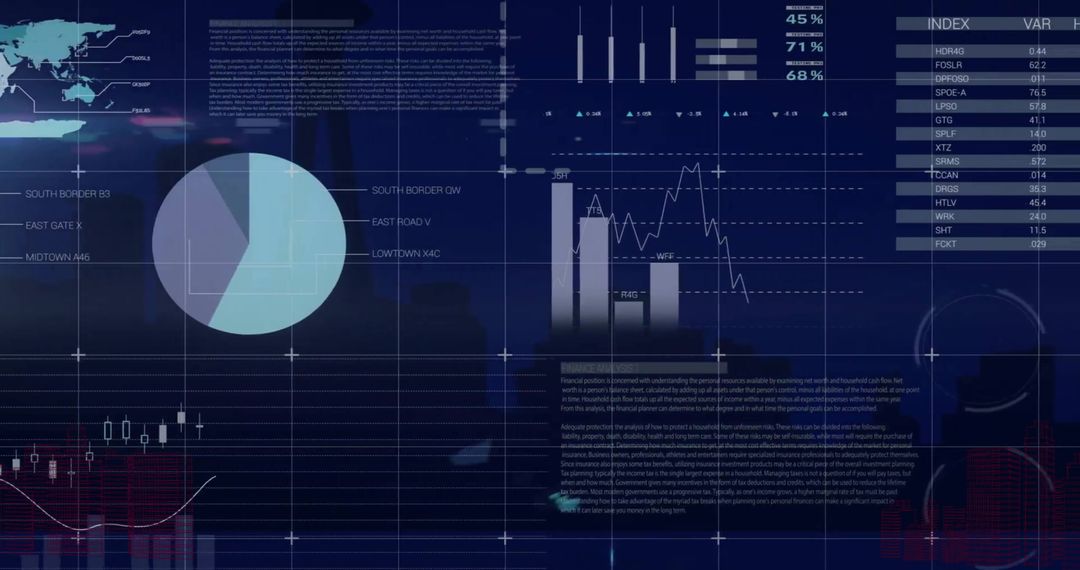
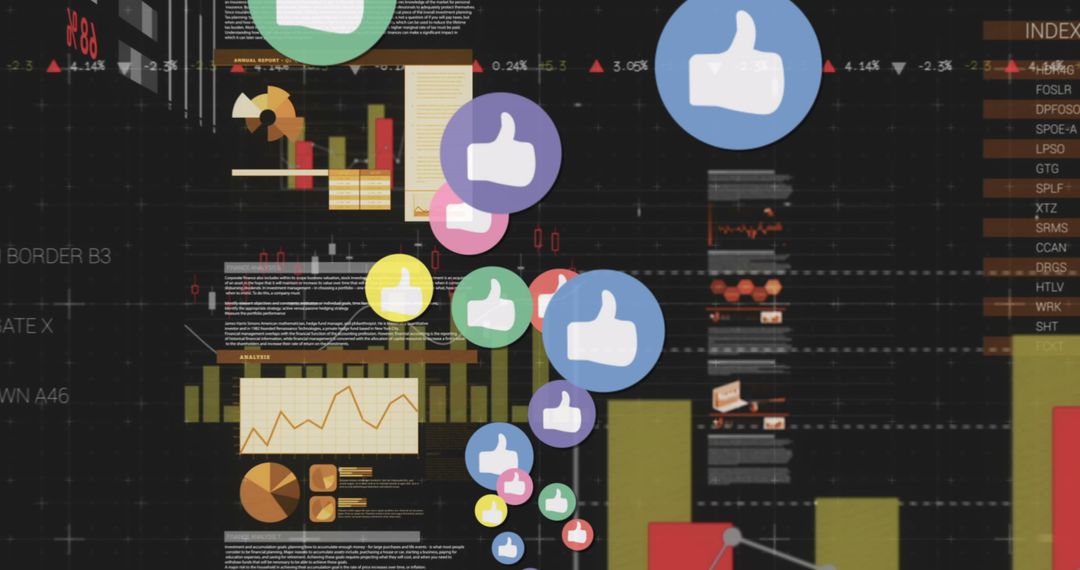
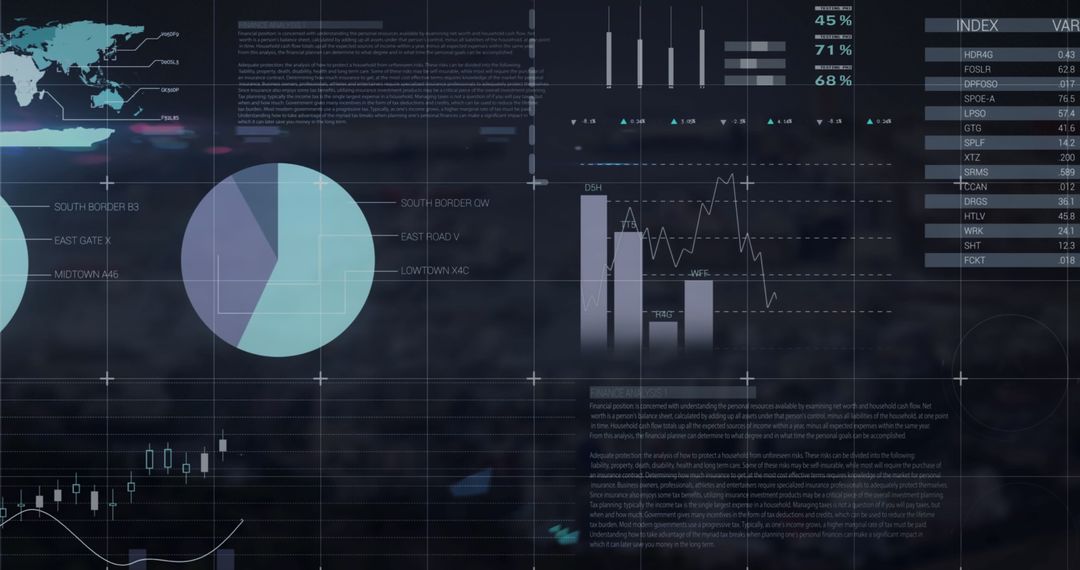
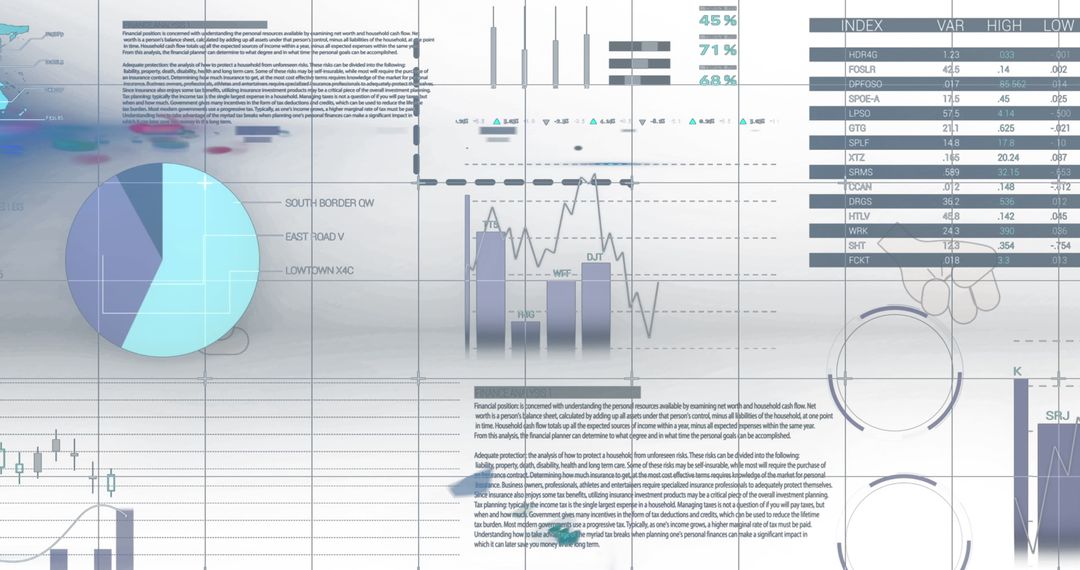
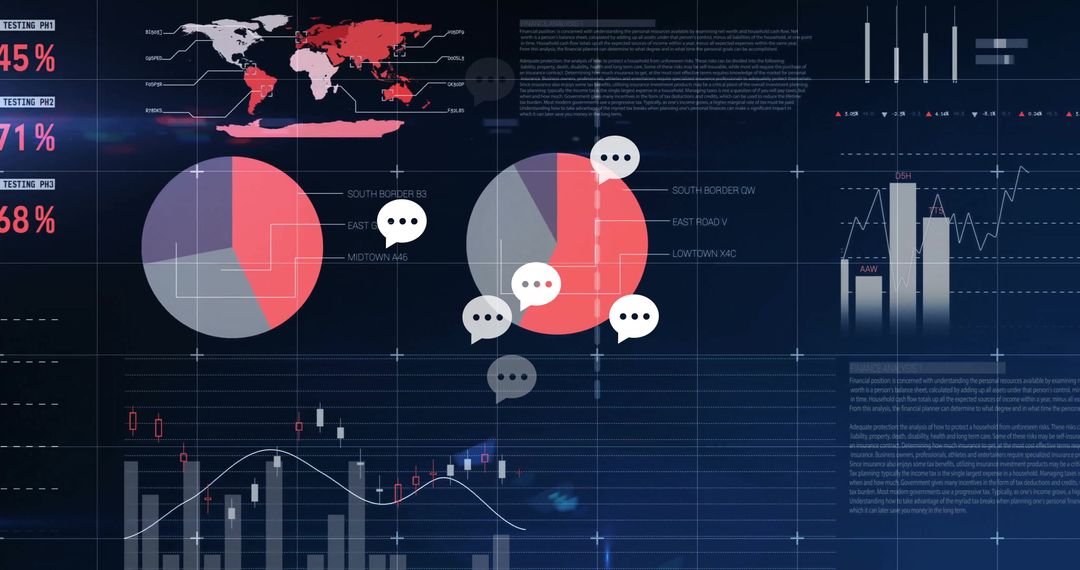
Collage of financial graphs and charts displayed over nebulous city lights background. Suitable for illustrating concepts of global finance, stock analysis, business strategy, and technological advancements in data processing. Can be used by businesses, financial institutions, or news media focusing on detailed economic discussions or visualizations.

Powered by Adobe logo
Digital stock market growth concept with arrows and data chart overlays on Bangkok city skyline at night in Asia, symbolizing financial success. - Powered by AdobeCropped unrecognizable person analyzing financial data on tablet. Generative AI image - Powered by AdobeTransparent or png stock market investment trading graph growth.Trade business analytics graph and financial chart.	
 - Powered by AdobeA close-up, macro shot of a black pen tip touching a red line on a digital screen displaying stock market data with green and orange glowing elements and bokeh - Powered by AdobeModern city skyline with financial growth data overlay representing real estate market trends and property investment analytics concept. - Powered by Adobe

Credit Photo

If you would like to credit the Photo, here are some ways you can do so

Free (free of charge)

Free for personal and commercial use.

Author: Authentic Images

Similar Free Stock Images

Digital Financial Data Interface with Analytics
Premium
Advanced robotic assistants working in a modern office analyzing financial data on computer screens with stock market graphs
Digital Head and Data Processing on Futuristic Interface
Digital Data Visualization Over Urban Skyline Concept
Digital Analytics Interface Overlaying Night City Traffic
Futuristic Data Analysis Interface with Graphs and Charts
Premium
Close up of a person s hand holding a glowing futuristic holographic projection of a rising stock market graph and financial data
Futuristic Data Visualization Interface with Graphs and World Map
Silhouetted Figures in Front of Dynamic Financial Data Display
Abstract Financial Analytics Interface with World Map and Data Charts
Statistical Data Overlay on Nighttime Cityscape Traffic Scene
Premium
Financial stock market candlestick chart overlaid on waving USA flag with glowing data symbols representing economic business concept and investment trends. Ai generative
Futuristic Virtual Data Analysis and Analytics Visualization
Financial Data Analytics Digital Interface
Financial Data Processing Visualization on Dark Background
Digital Financial Data Processing Concept with Charts
Premium
Colorful glowing candlestick chart with trend lines on dark background showing financial and stock market data analytics concept.
Futuristic Data Visualization with Mathematical Equations and Graphs
Digital Financial Data Interface on Dark Background
Businesswoman Presenting Financial Data with Charts in Modern Office
Dynamic Changing Data Visualization in Digital Dashboard
Premium
Magnifying glass focusing on financial chart with coins, symbolizing investment analysis and market trends, evoking curiosity and insight
Business Charts and Data Visualization in Team Meeting Environment
Digital Human Biology Data Interface Display
Global Digital Interface with Data Points and Code
Binary Code and Financial Graphs Overlaying Urban Skyline
Premium
A trader's hand touching a glowing digital screen, analyzing complex stock market data, charts, and financial statistics.
Dynamic Financial Dashboard with Visual Data Analytics
Cybersecurity Dashboard with Real-Time Analytics and Geometric Charts
Futuristic Dashboard Displaying Data Analytics and Visualization
Digital Interface with Data Visualization Dashboard Statistics
Global Financial Data Analysis on Digital Interface
Global Financial Data Analysis Over High-Speed Cityscape
Premium
Analyzing financial growth charts for strategic business decisions and investment opportunities, envisioning success with data-driven insights and projections
Data Processing in 3D Cityscape with Digital Interface
Digital Interface Showing Stock Market Data Analysis
Digital Financial Data Analysis with Graphs and Charts
Financial Data Analysis with Diverse Workforce Representation
Premium
Businessman hand holding virtual glowing arrow up icon, representing business growth, financial performance, investment success and positive economic trend with percentage symbols.
Futuristic Digital Interface with Global Charts and Data
Digital Analytics and Business Growth Over Modern Cityscape
Data Analytics Interface with Code and Graphs
Abstract Financial Data Processing Interface
Premium
A luminous digital human brain is intersected by an ascending blue financial graph, symbolizing intellectual growth, market progress, and strategic development.
Futuristic Financial Data Visualization Against Urban Skyline
Financial Data Charts & Analysis on Dark Screen
Digital Global Analytics Interface with Infographics and Data Visualization
Abstract Digital Dashboard with Data Visualizations
Premium
Data analyzing and stock market visualization with digital charts, financial dashboards, and performance metrics. Ideal for investment analysis, trading strategy, and economic forecasting.
Dynamic Financial Data Analysis on Digital Screen
Dynamic Global Business Data and Financial Charts Overlay
Digital Interface with Envelopes on Data Analytics Dashboard
Dynamic Numbers and Data with Futuristic Digital Interface
Premium
Stock market investment trading graph growth.Trade business analytics graph and financial chart.Finance chart,stock market business and exchange financial growth graph.
Digital Financial Data Processing Interface with Graphs and Codes
Global Data Integration and Digital Networking Visualization
Digital Data Visualization Interface in Modern Business Concept
Colorful Financial Graphs and Data Visualization
Premium
Businesswoman typing on laptop with digital financial chart overlay, representing data analysis, stock market trends, economic growth, investment, business strategy, and modern technology.
Dark-Themed Hacking Terminal with Code Panels
Futuristic Analytics Dashboard with Map and Chart Visualization
Global Digital Interface with Data Analytics and Thumbs-Up Rating Icon
Global Finance Data Visualization Over Urban Cityscape
Dynamic Digital Data Visualization with Graphs and Statistics
Digital Data Processing Interface on Navy Background
Premium
Red stock market chart, financial crisis, digital data, analytics
Futuristic Digital Interface Displaying Data and Graphs
Digital Interface Displaying Financial and Data Charts in Blue Tones
Comprehensive Financial Data Analytics Interface with Global Indicators
Advanced Financial Analysis with Digital Charts and Graphs
Premium
Magnifying glass reveals detailed stock market candlestick chart on financial report, symbolizing investment analysis and business growth. Ai Generated Images
City Traffic Data Processing with Futuristic Interface Visualization
Global Financial Data and Analytics Visualization Concept
Statistical Analysis Overlay in Modern Data Center
Digital Infographic Overlay with Global Business Growth Trends
Premium
glowing financial stock market chart with a rising arrow for business success, data analysis, and investment concepts
Data Processing Overlaid on Graphs and Code in Digital Interface
Digital Interface with Data Visualization and Globe Overlays
Global Financial Data Visualizations with Charts and World Map
Financial Data Processing Interface on Black Background
Premium
The magnifying glass highlighting financial data and market trends on paper.
Digital Communication Concept with Statistic Visuals
Dynamic Graphs and Financial Statistics in Digital Interface
Complex Digital Dashboard Interface Displaying Financial Data and Growth Analytics
American Football Player with Digital Data Interface Visualization
Premium
Glowing Green Orange Financial Market Data Display stock market financial data
Digital City Layout with Data Processing Visualization
Digital Thumbs-Up over Radial Charts and Data Analytics Background
Digital Data Processing with City Views for Tech Analytics
Interactive Analytics UI with Charts, Graphs and Notifications
Premium
Dynamic stock market chart with vibrant blue and pink bars showing upward trend and financial data visualization in a futuristic digital interface
Healthcare Professionals Analyzing Digital Data Charts Collaboration
Displaying Cybersecurity Dashboard with Global Map, Donut Chart, Candlestick and Tabular Data
Financial Data Overlays Cityscape Signifying Market Dynamics
Digital Code Overlay on Night Cityscape
Digital Data Processing Dashboard in Global Connection Visualization
Data Analysis Dashboard Overlaid on Night City Traffic Background
Premium
Dynamic digital financial graph with glowing purple and blue trend lines on dark background displaying market analytics data for investment technology
Business Overview with Infographics and Financial Data Analytics
Futuristic Digital Dashboard with Business Analytics
Digital Interface Data Processing in Virtual Server Environment
Abstract Financial Report Data with Graphs and World Map
Premium
Futuristic digital dashboard with glowing stock market graphs and blurred city skyline background reflecting advanced finance technology and data analytics
Digital Display of Global Financial Data Processing
Stock Market Analysis Digital Screen with Graphs and Trends
Dynamic Financial Data Visualization on Digital Interface
Global Financial Data Processing with Charts and Graphs
Premium
Glowing orange arrow ascends on dark digital financial chart
Futuristic Cityscape with Scanning Analysis Interface at Sunset
Digital Financial Data Processing with Charts and Graphs
Digital Business Analysis Over Cityscape at Night
Global Finance and Data Analysis Concept with Graphs
Premium
Business partnership handshake with superimposed financial data graphs
Digital Social Media Engagement With Statistical Analysis
Digital Interface with Global Financial Data and Graphs
Analyzing Complex Data Visualizations in Technology and Finance
Complex Financial Data Visualization with Analytics Overlay
Premium
Financial market crash with red downward arrow and graphs indicating global economic recession and business investment losses on digital screen.
Global Connectivity Concept with Digital User Profiles
Digital Data Dashboard with Interactive Charts
Innovative Data Visualization Dashboard with Interactive UI
Futuristic Data Analytics Interface with World Map and Charts
Premium
Financial market data analysis with glowing 3D bar and line charts on dark background showing economic trends and growth concept visualization. 3D Rendering
Layered Cybersecurity Displaying Terminal Access, Analytics, Pie and Candlestick Charts