
- Home >
- Stock Photos >
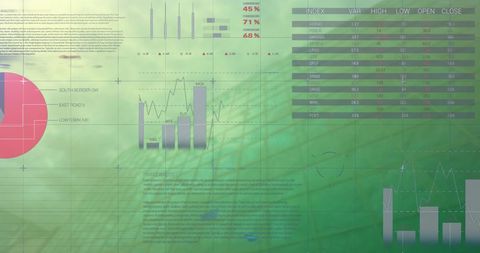
- Financial Data and Analytics Visualization in Digital Interface
Financial Data and Analytics Visualization in Digital Interface Image

Abstract digital interface displaying financial data visualization with various graphs and charts, conveying a sense of advanced technology in finance. Ideal for use in business presentations, finance and investment topics, and technology and data analytics content, showcasing insights in a modern, digital format.
Powered by  - Get 15% off with code: PIKWIZARD15


downloads
Tags:
More
Credit Photo
If you would like to credit the Photo, here are some ways you can do so
Text Link
photo Link
<span class="text-link">
<span>
<a target="_blank" href=https://pikwizard.com/photo/financial-data-and-analytics-visualization-in-digital-interface/233e3420ceb9f380d35a62be6927facd/>PikWizard</a>
</span>
</span>
<span class="image-link">
<span
style="margin: 0 0 20px 0; display: inline-block; vertical-align: middle; width: 100%;"
>
<a
target="_blank"
href="https://pikwizard.com/photo/financial-data-and-analytics-visualization-in-digital-interface/233e3420ceb9f380d35a62be6927facd/"
style="text-decoration: none; font-size: 10px; margin: 0;"
>
<img src="https://pikwizard.com/pw/medium/233e3420ceb9f380d35a62be6927facd.jpg" style="margin: 0; width: 100%;" alt="" />
<p style="font-size: 12px; margin: 0;">PikWizard</p>
</a>
</span>
</span>
Free (free of charge)
Free for personal and commercial use.
Author: People Creations
Similar Free Stock Images

Premium


Premium


Premium


Premium


Premium

Premium


Premium


Premium


Premium

Premium

Premium

Premium


Premium

Premium


Premium


Premium


Premium

Premium


Premium


Premium


Premium

Premium


Premium


Premium


Premium


Explore More Free Stock Images