
- Home >
- Stock Photos >
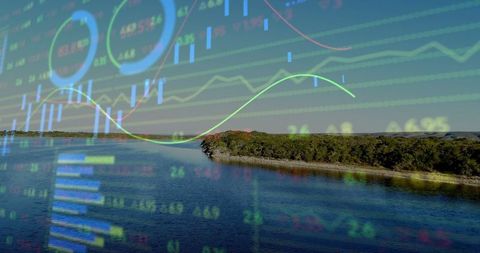
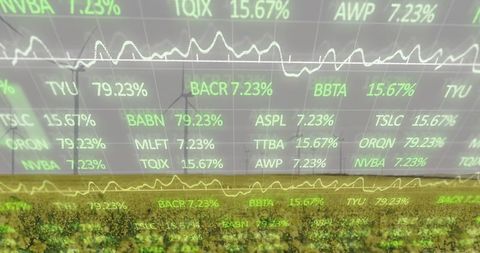
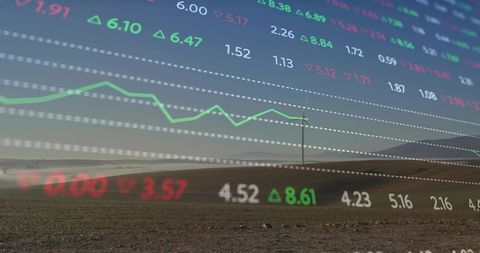
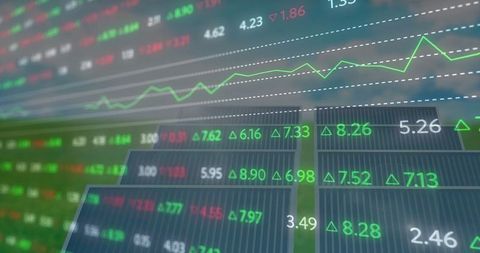
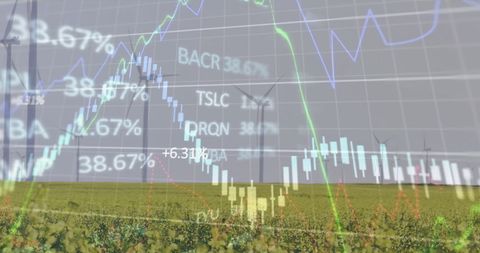
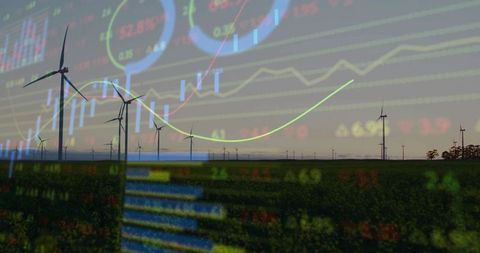
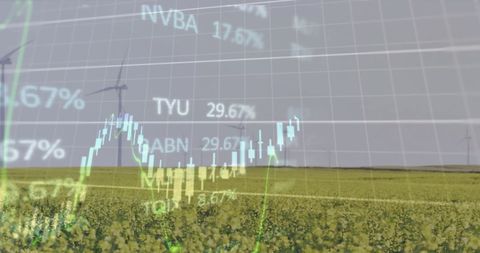
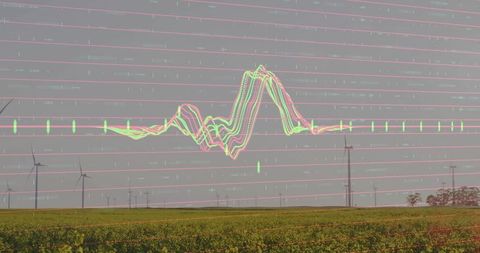
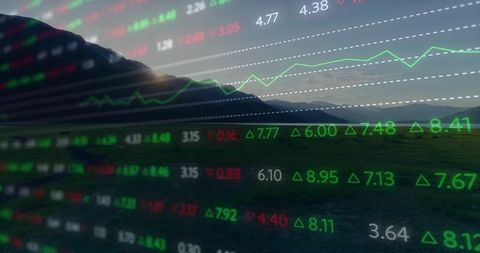
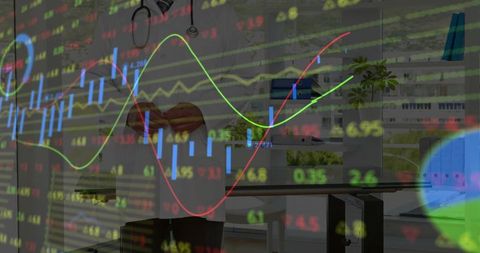
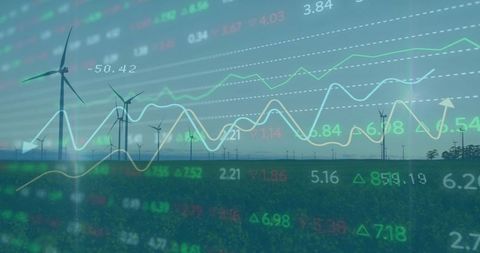
- Financial Data and Analytics Visualization in Natural Landscape
Financial Data and Analytics Visualization in Natural Landscape Image
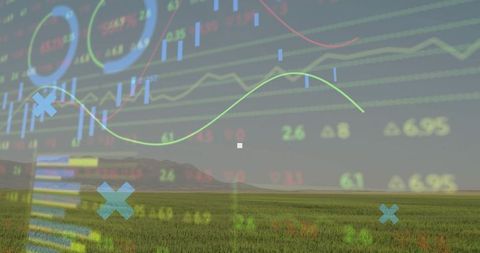
Technology meets nature in this imaginative illustration, depicting financial data overlay in a grassland setting. Abstract lines and graphs hover over green fields, representing the fusion of digital analytics and natural environments. Use this visual to promote articles on sustainable investments, eco-friendly financial technology, or innovations in agriculture tech.
Powered by 


downloads
Tags:
More
Credit Photo
If you would like to credit the Photo, here are some ways you can do so
Text Link
photo Link
<span class="text-link">
<span>
<a target="_blank" href=https://pikwizard.com/photo/financial-data-and-analytics-visualization-in-natural-landscape/7ae370be53eba2e0766fda1dd56c266b/>PikWizard</a>
</span>
</span>
<span class="image-link">
<span
style="margin: 0 0 20px 0; display: inline-block; vertical-align: middle; width: 100%;"
>
<a
target="_blank"
href="https://pikwizard.com/photo/financial-data-and-analytics-visualization-in-natural-landscape/7ae370be53eba2e0766fda1dd56c266b/"
style="text-decoration: none; font-size: 10px; margin: 0;"
>
<img src="https://pikwizard.com/pw/medium/7ae370be53eba2e0766fda1dd56c266b.jpg" style="margin: 0; width: 100%;" alt="" />
<p style="font-size: 12px; margin: 0;">PikWizard</p>
</a>
</span>
</span>
Free (free of charge)
Free for personal and commercial use.
Author: People Creations
Similar Free Stock Images
Premium


Premium

Premium

Premium

Premium


Premium


Premium


Premium


Premium


Premium


Premium


Premium


Premium


Premium

Premium

Premium


Premium


Premium


Premium

Premium


Premium

Premium

Premium


Premium


Premium


Explore More Free Stock Images