
- Home >
- Stock Photos >
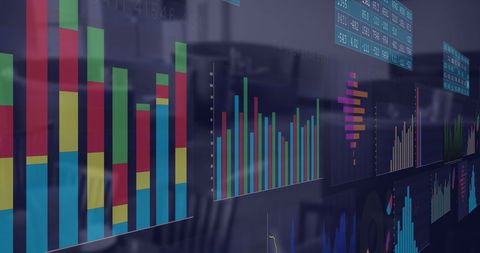
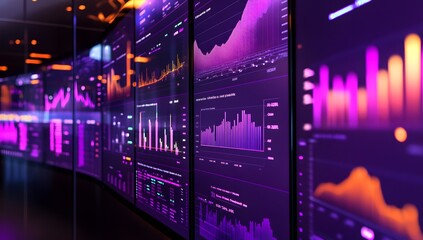
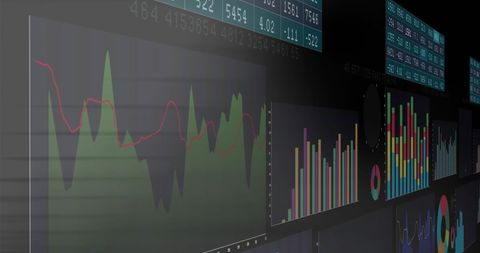
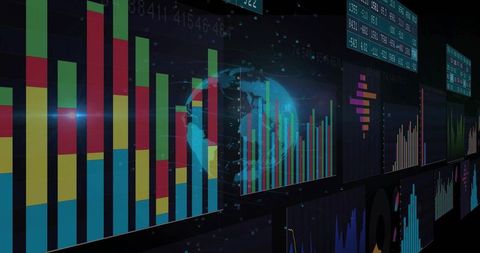
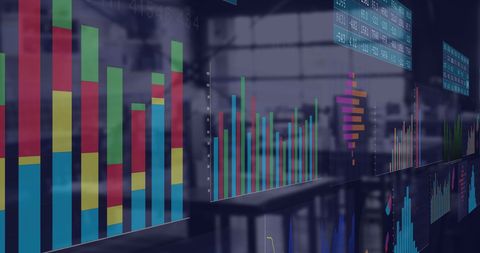
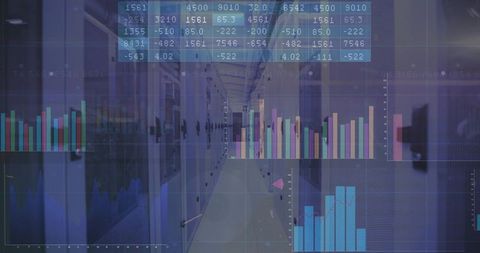
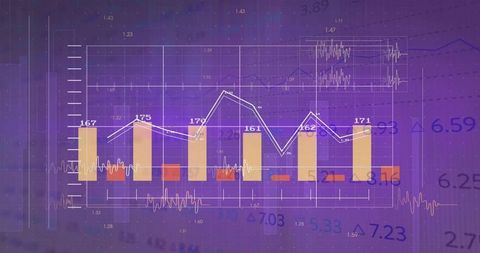
- Financial Data and Bar Graphs on Digital Interface Background
Financial Data and Bar Graphs on Digital Interface Background Image

Visualization shows bar graphs and financial data on a digital screen, representing trends and statistics in global finance or business analytics. Ideal for presentations, reports, and educational materials aiming to explain financial forecasts, market trends, or investment insights. Useful for illustrating data analysis or digital finance technology concepts.
Powered by 


downloads
Tags:
More
Credit Photo
If you would like to credit the Photo, here are some ways you can do so
Text Link
photo Link
<span class="text-link">
<span>
<a target="_blank" href=https://pikwizard.com/photo/financial-data-and-bar-graphs-on-digital-interface-background/e7c9f9f8cf294b304e4aaaefd8bd69d7/>PikWizard</a>
</span>
</span>
<span class="image-link">
<span
style="margin: 0 0 20px 0; display: inline-block; vertical-align: middle; width: 100%;"
>
<a
target="_blank"
href="https://pikwizard.com/photo/financial-data-and-bar-graphs-on-digital-interface-background/e7c9f9f8cf294b304e4aaaefd8bd69d7/"
style="text-decoration: none; font-size: 10px; margin: 0;"
>
<img src="https://pikwizard.com/pw/medium/e7c9f9f8cf294b304e4aaaefd8bd69d7.jpg" style="margin: 0; width: 100%;" alt="" />
<p style="font-size: 12px; margin: 0;">PikWizard</p>
</a>
</span>
</span>
Free (free of charge)
Free for personal and commercial use.
Author: Authentic Images
Similar Free Stock Images

Premium


Premium


Premium


Premium


Premium
Premium


Premium

Premium


Premium


Premium

Premium


Premium


Premium

Premium


Premium


Premium


Premium
Premium

Premium


Premium


Premium


Premium


Premium


Premium


Premium

Explore More Free Stock Images