- Home >
- Stock Photos >
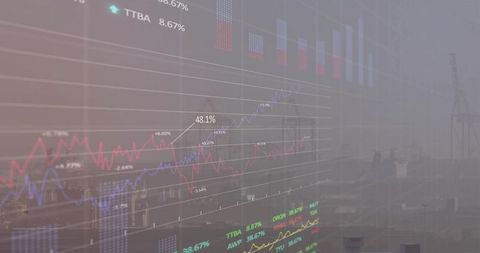
- Financial Data and Global Business People in Office Reflecting Virtual Analytics
Financial Data and Global Business People in Office Reflecting Virtual Analytics Image

Blurring lines between technological graphs and diverse professionals in a modern corporate setting, showing a blend of interactivity and data-driven decision making. Suitable for illustrating financial analysis, global teamwork, investment strategies, and modern corporate environments highlighting diversity and digital innovation.
Powered by 


2
downloads
downloads
Tags:
More
Credit Photo
If you would like to credit the Photo, here are some ways you can do so
Text Link
photo Link
<span class="text-link">
<span>
<a target="_blank" href=https://pikwizard.com/photo/financial-data-and-global-business-people-in-office-reflecting-virtual-analytics/df4668ae3d2643f5a4db918398ab01a9/>PikWizard</a>
</span>
</span>
<span class="image-link">
<span
style="margin: 0 0 20px 0; display: inline-block; vertical-align: middle; width: 100%;"
>
<a
target="_blank"
href="https://pikwizard.com/photo/financial-data-and-global-business-people-in-office-reflecting-virtual-analytics/df4668ae3d2643f5a4db918398ab01a9/"
style="text-decoration: none; font-size: 10px; margin: 0;"
>
<img src="https://pikwizard.com/pw/medium/df4668ae3d2643f5a4db918398ab01a9.jpg" style="margin: 0; width: 100%;" alt="" />
<p style="font-size: 12px; margin: 0;">PikWizard</p>
</a>
</span>
</span>
Free (free of charge)
Free for personal and commercial use.
Author: Authentic Images
Similar Free Stock Images
Loading...

Premium


Premium


Premium


Premium


Premium

Premium


Premium


Premium


Premium


Premium


Premium


Premium


Premium

Premium


Premium

Premium


Premium


Premium

Premium


Premium


Premium


Premium


Premium


Premium

Premium