- Home >
- Stock Photos >
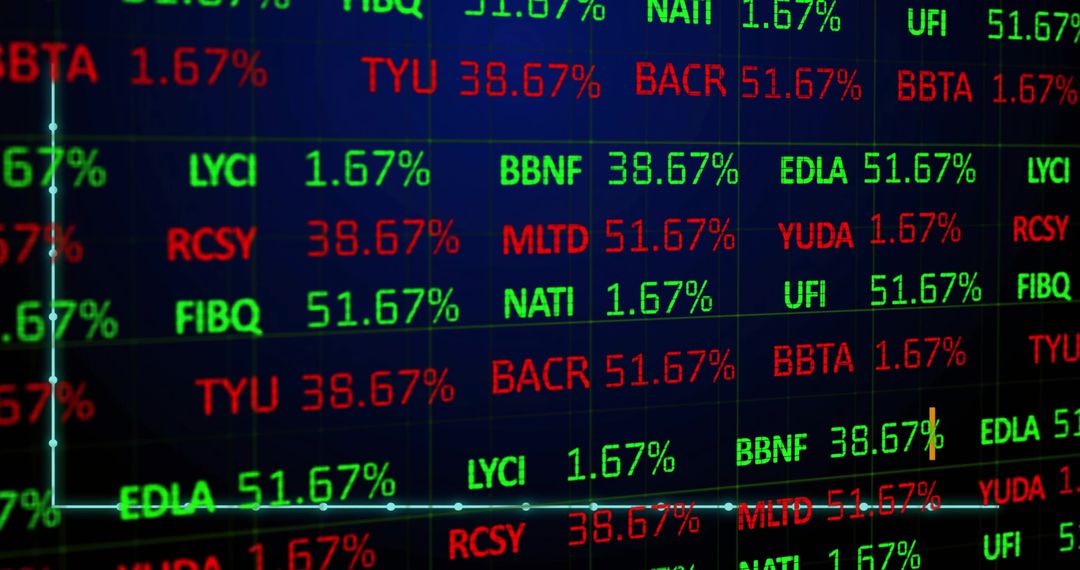
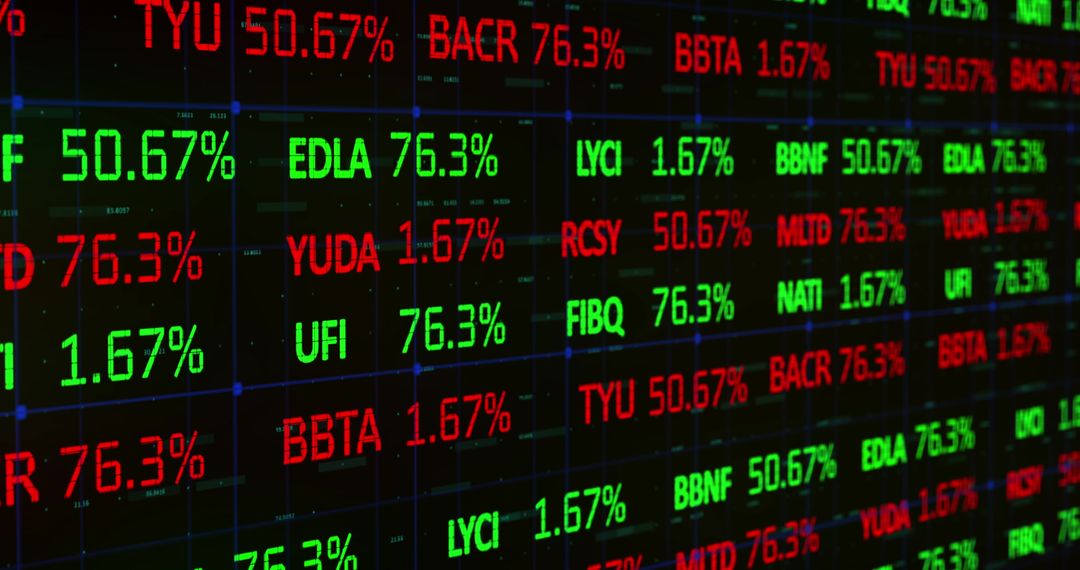
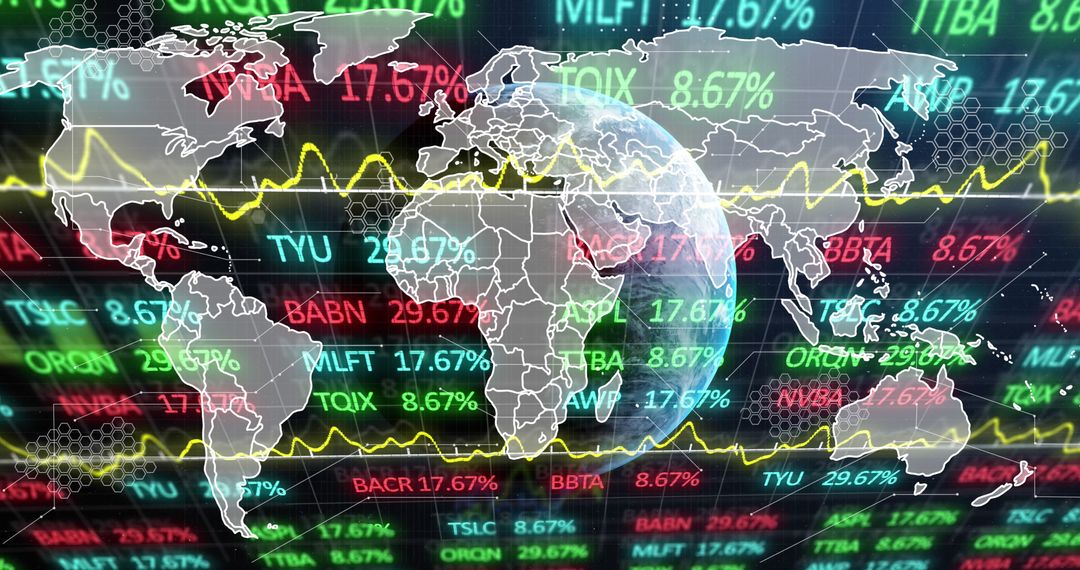
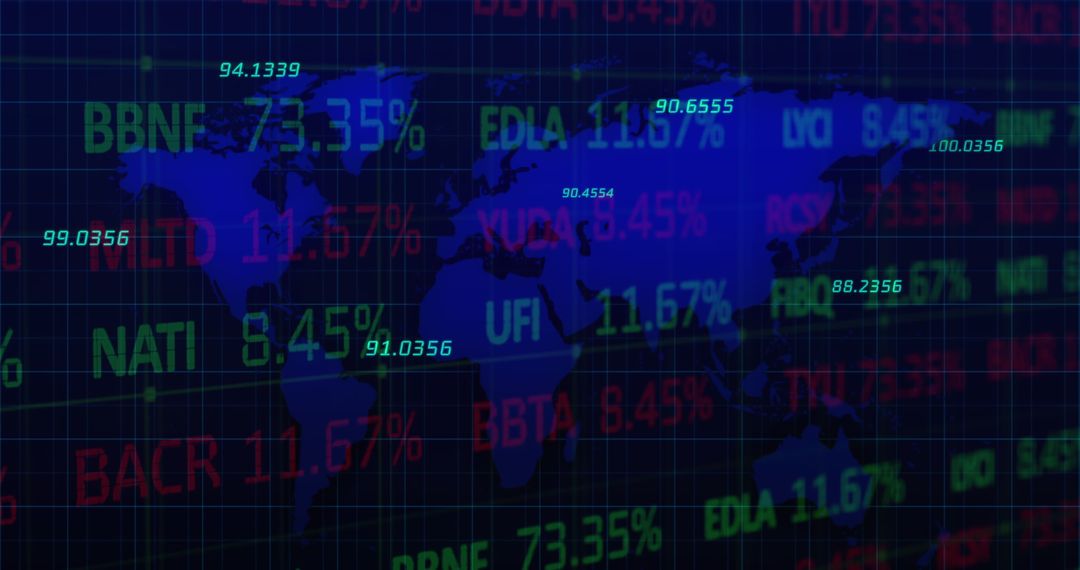
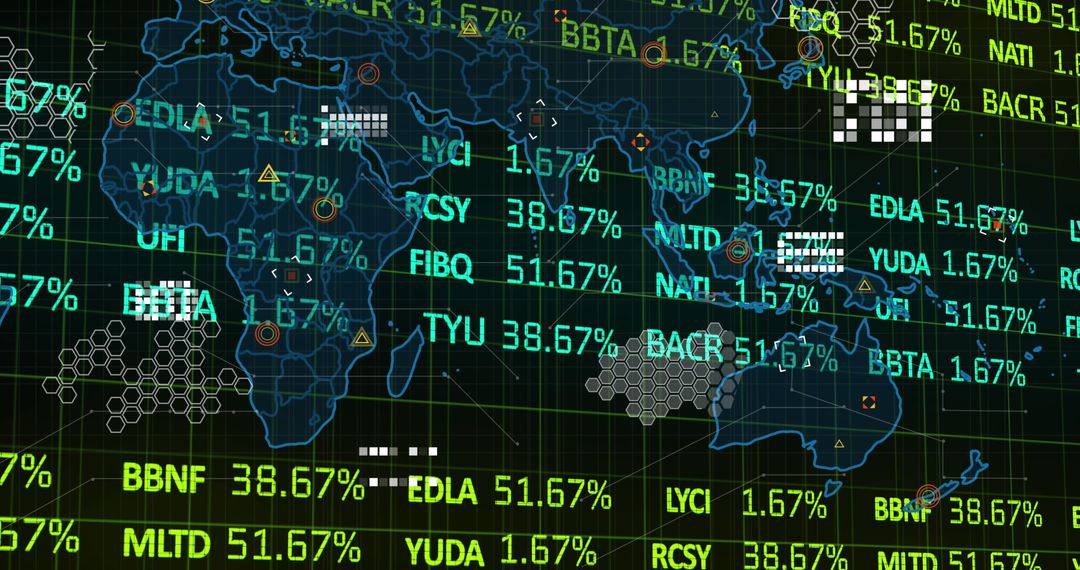
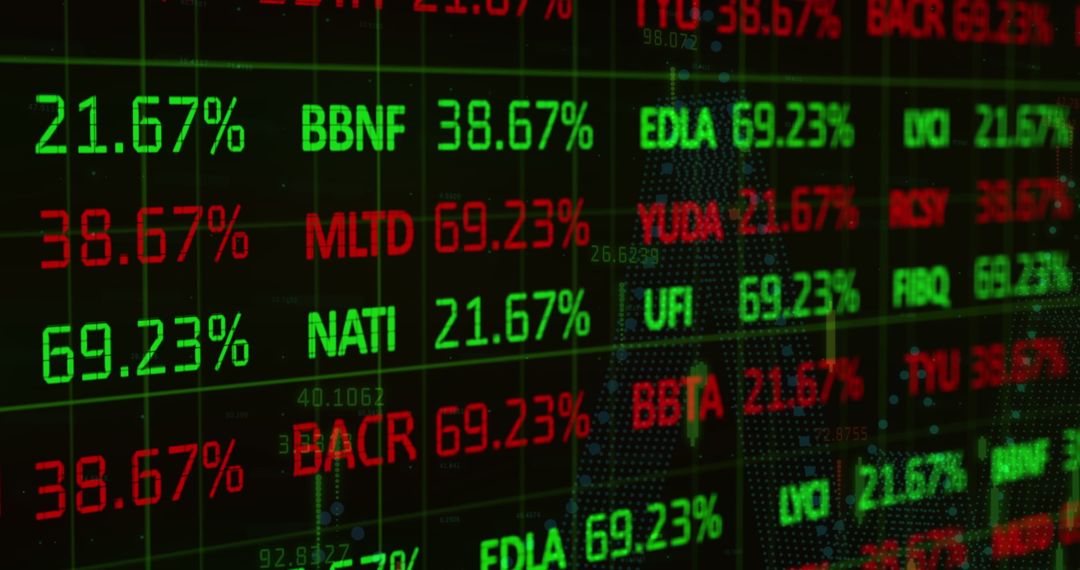
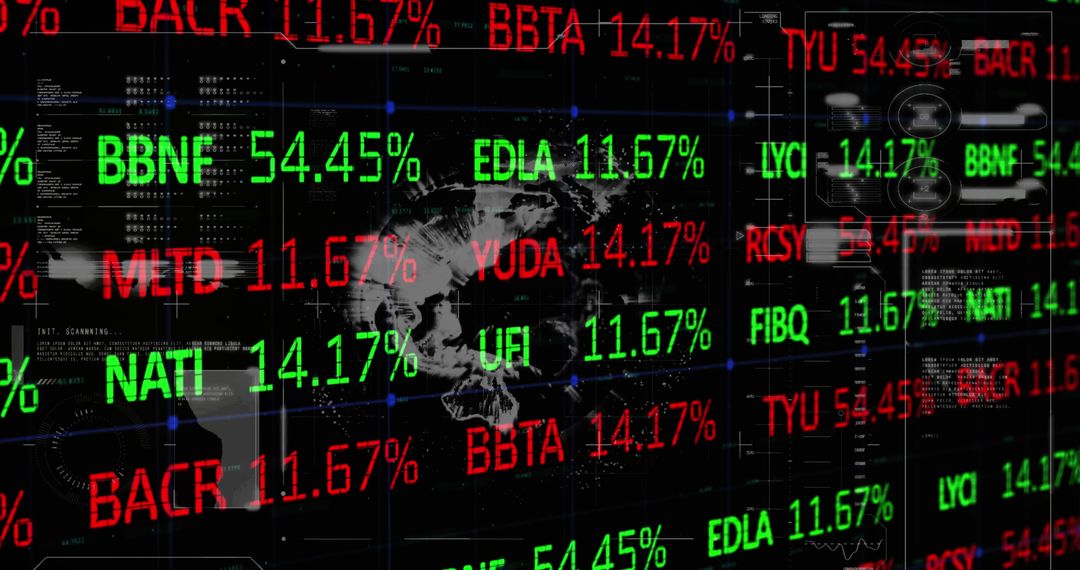
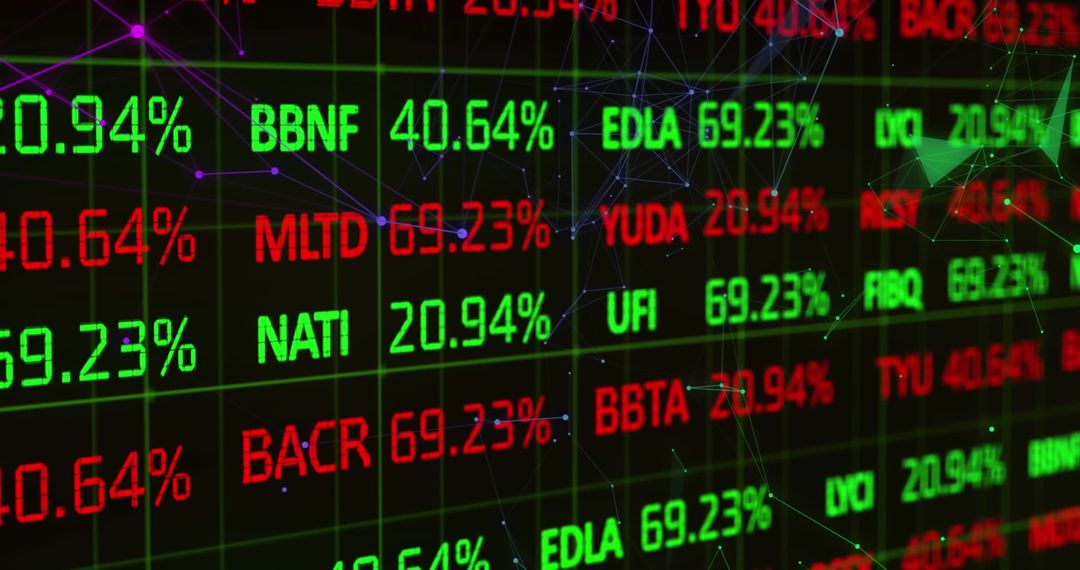
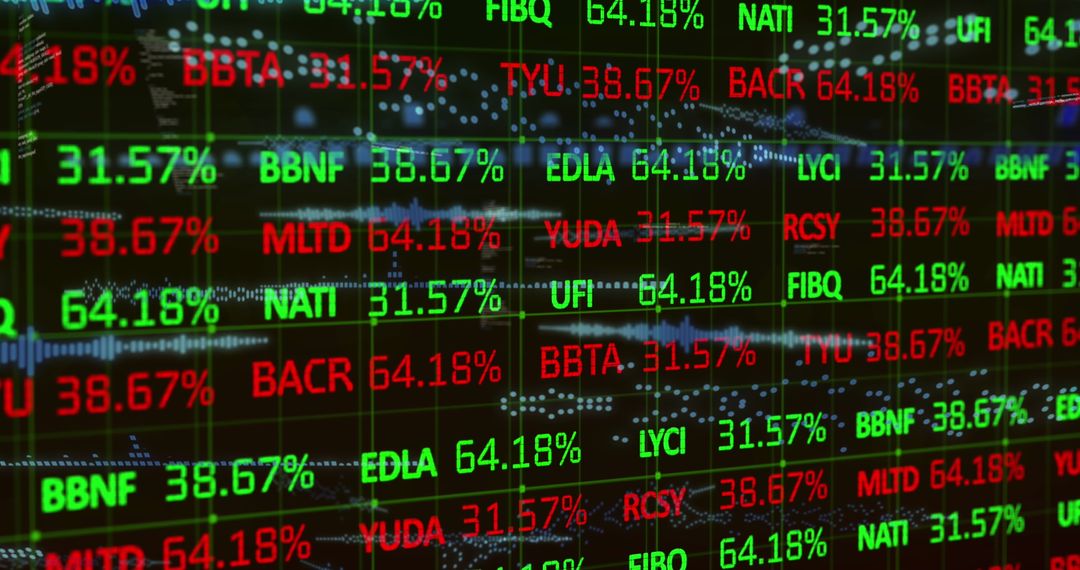
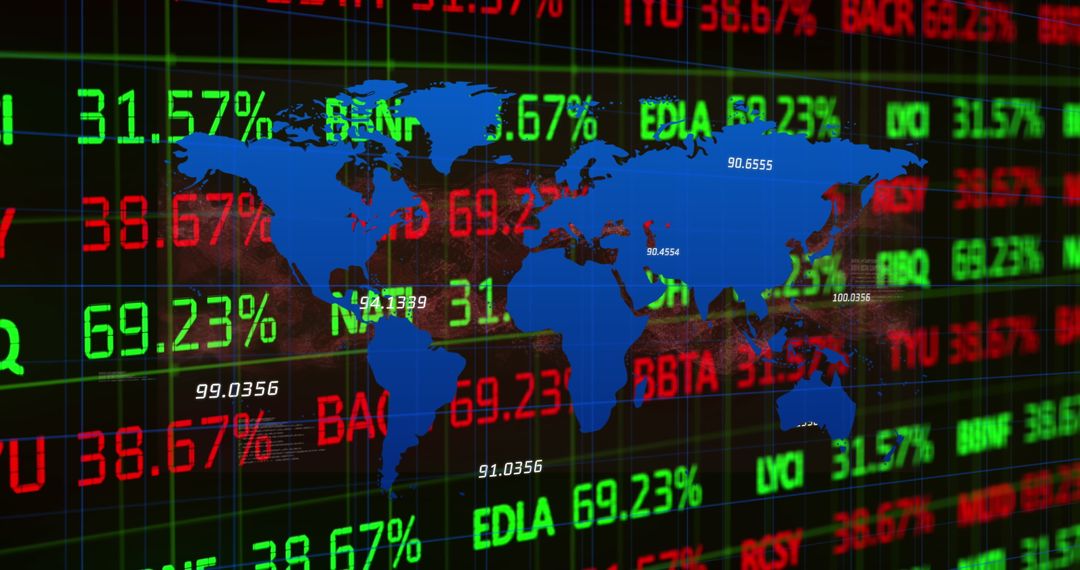
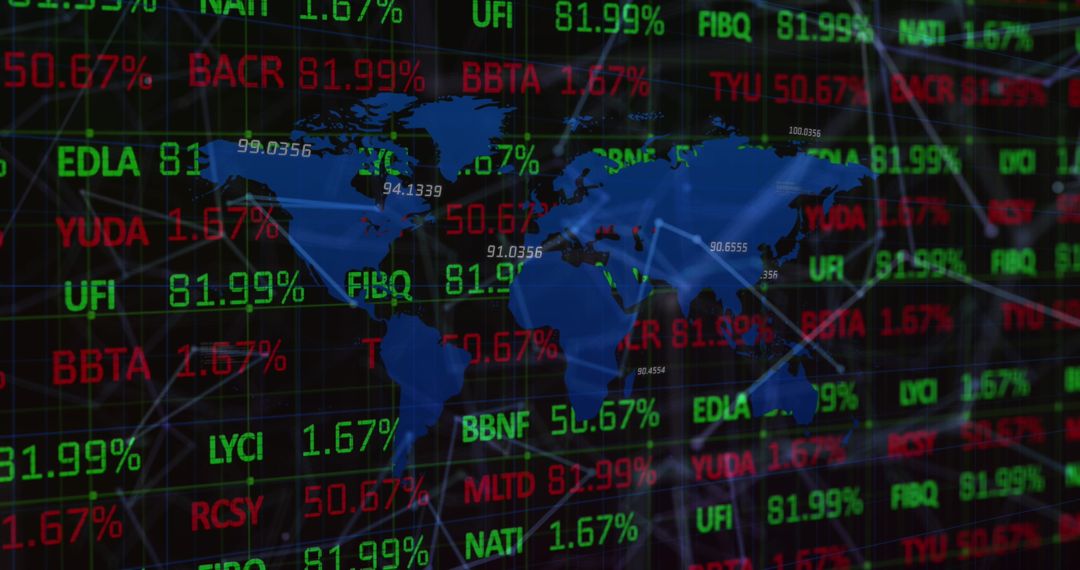
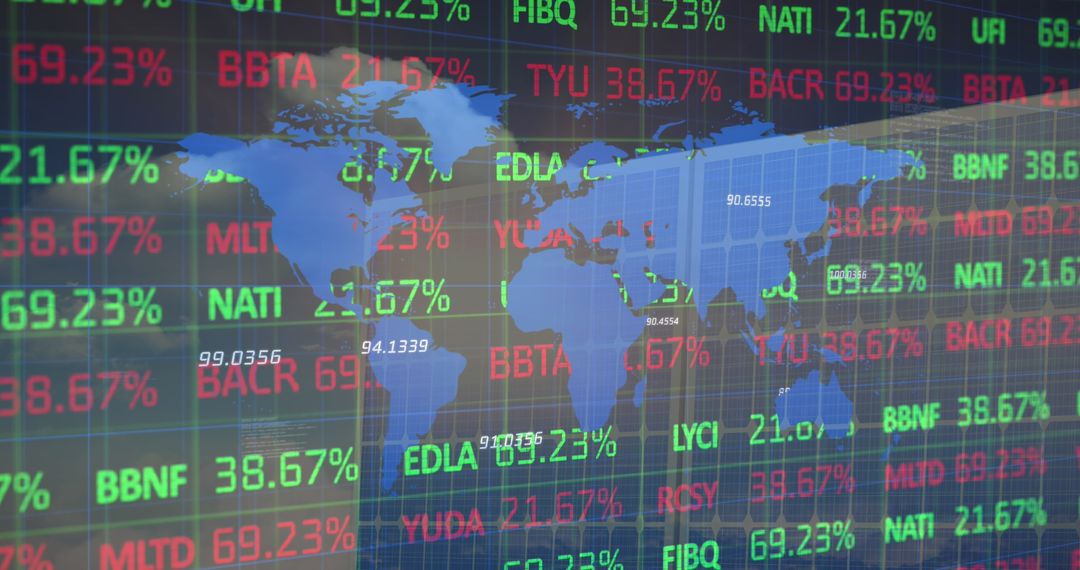
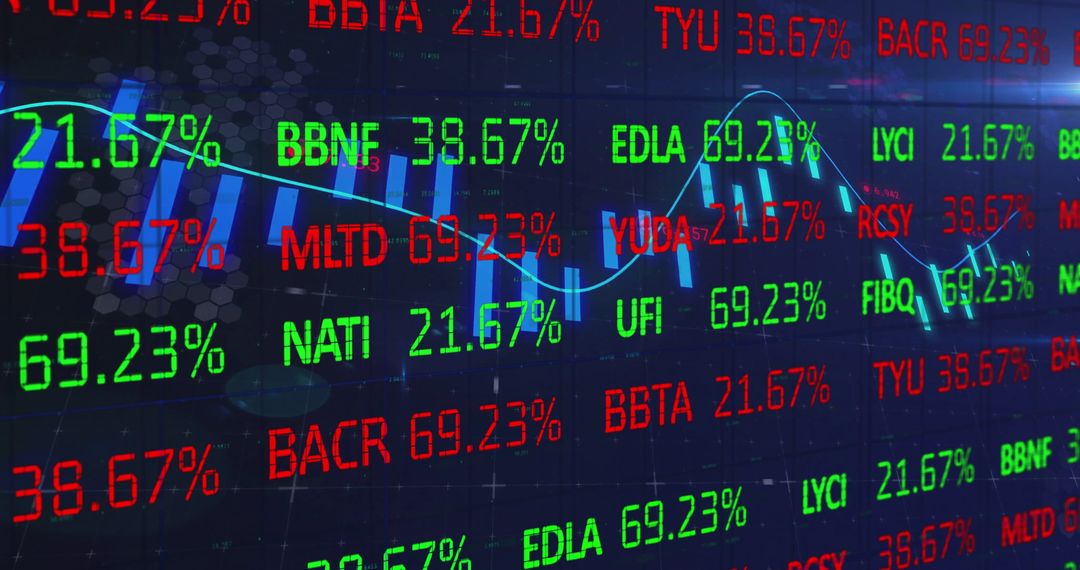
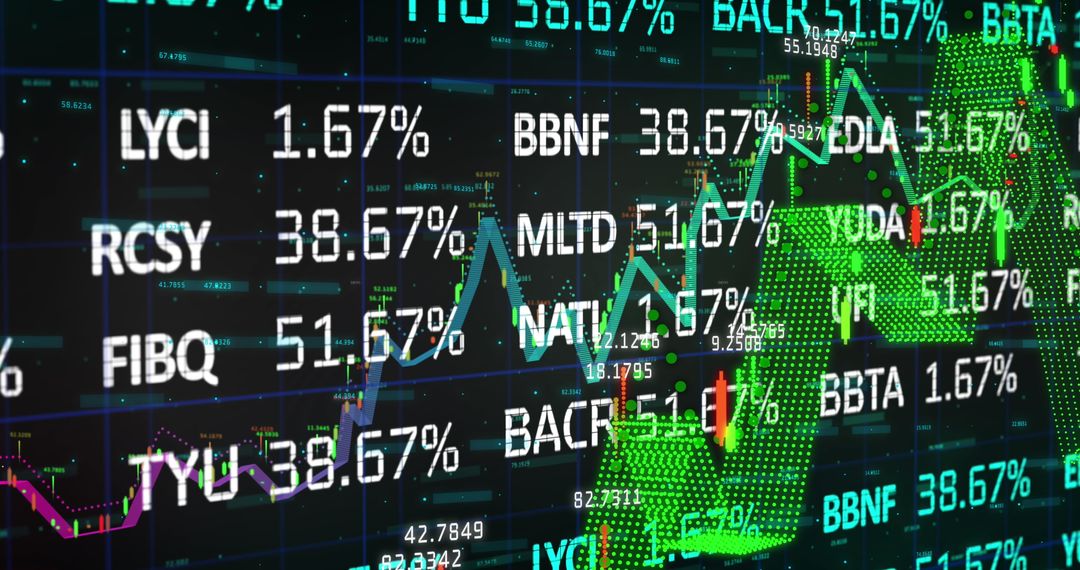
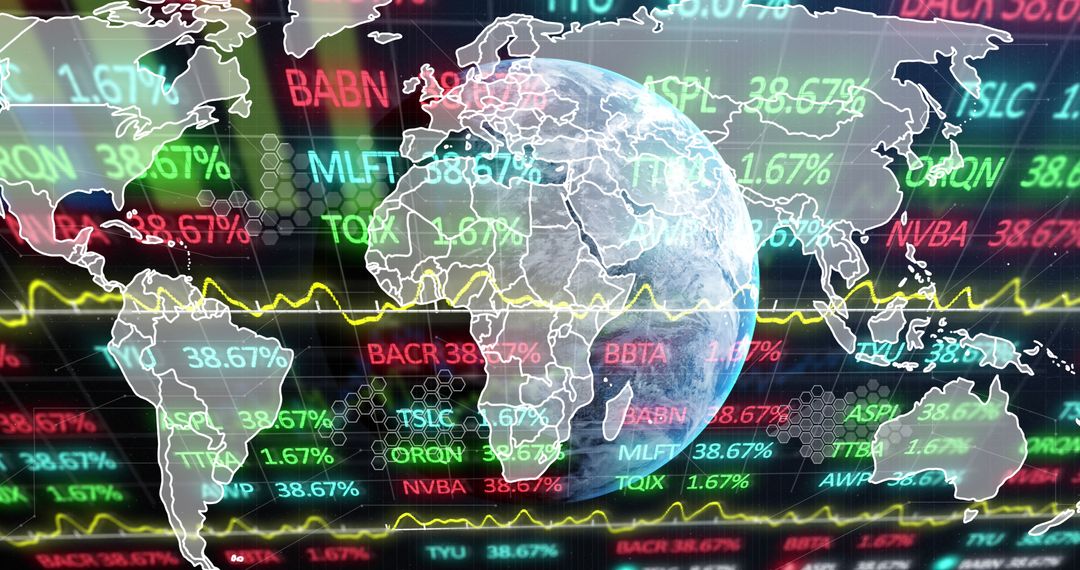
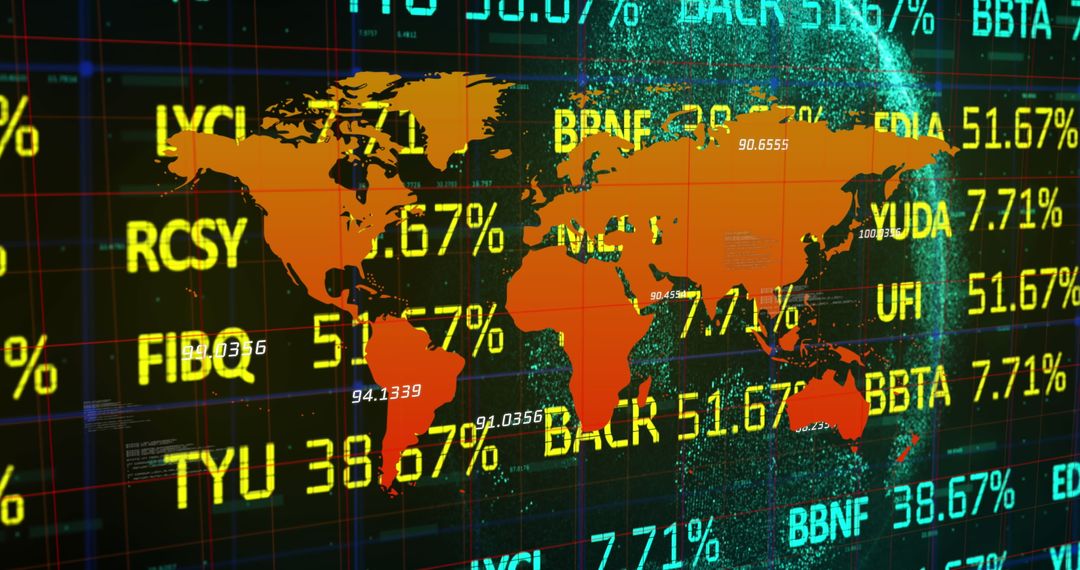
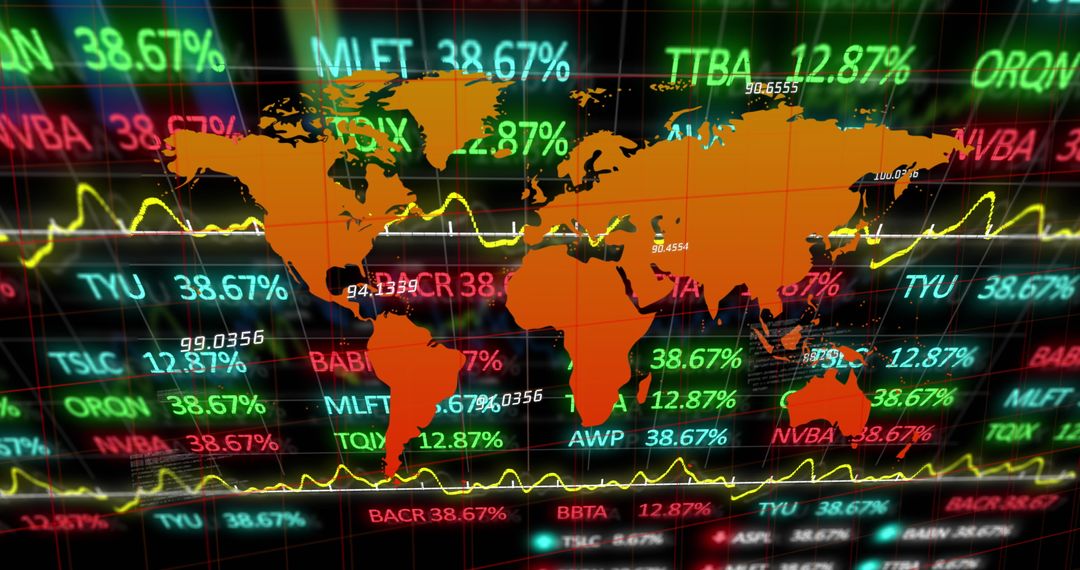
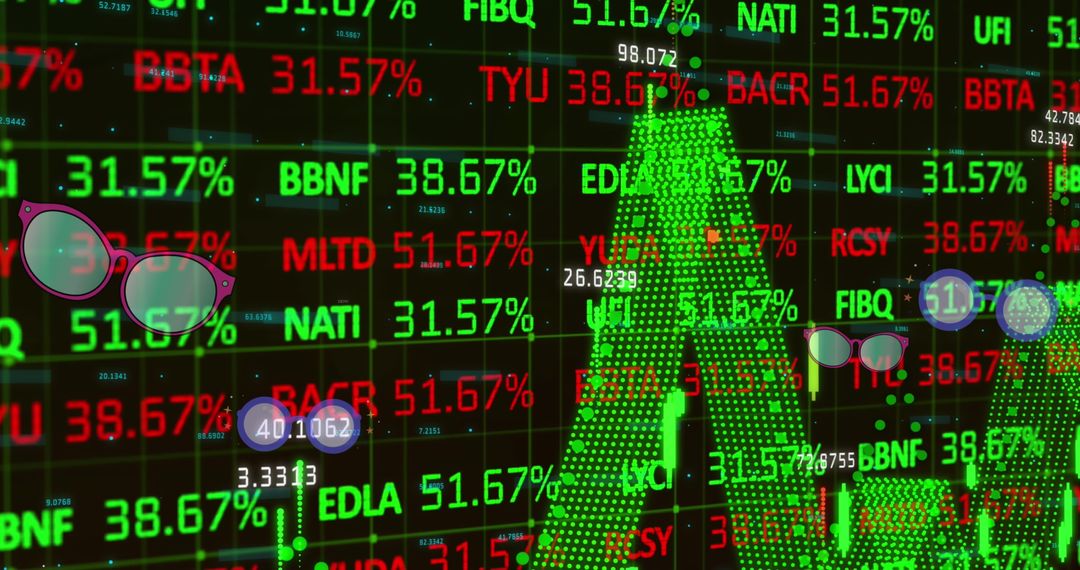
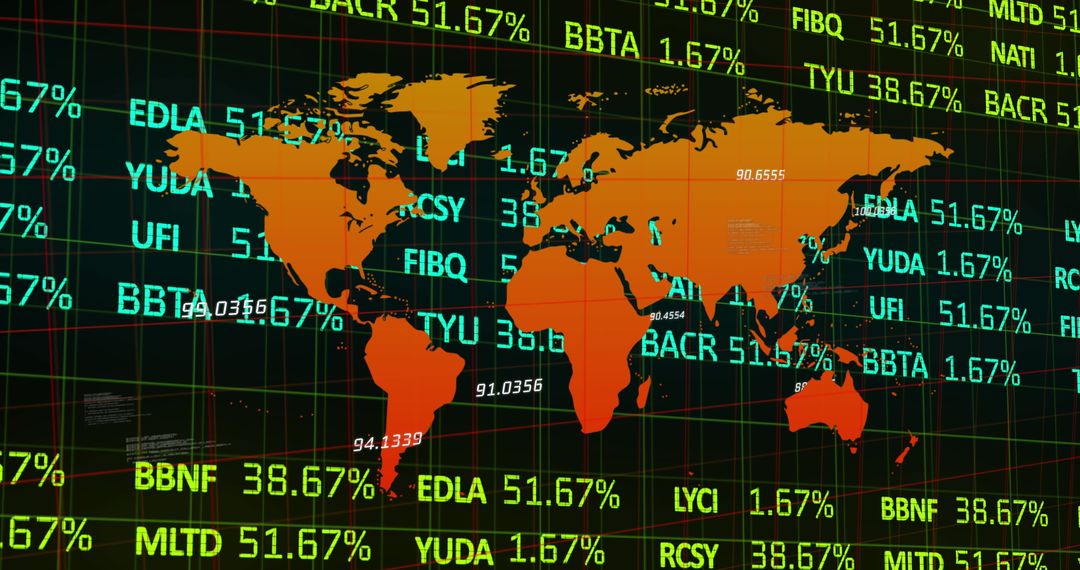
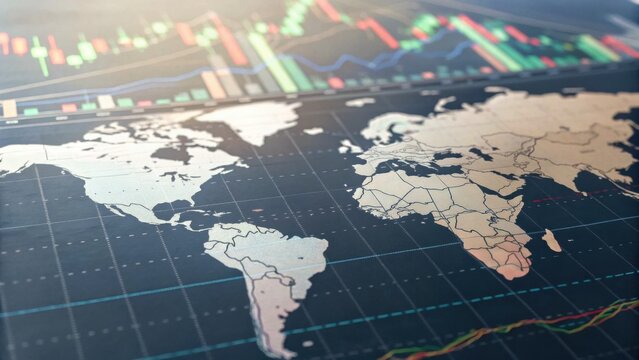
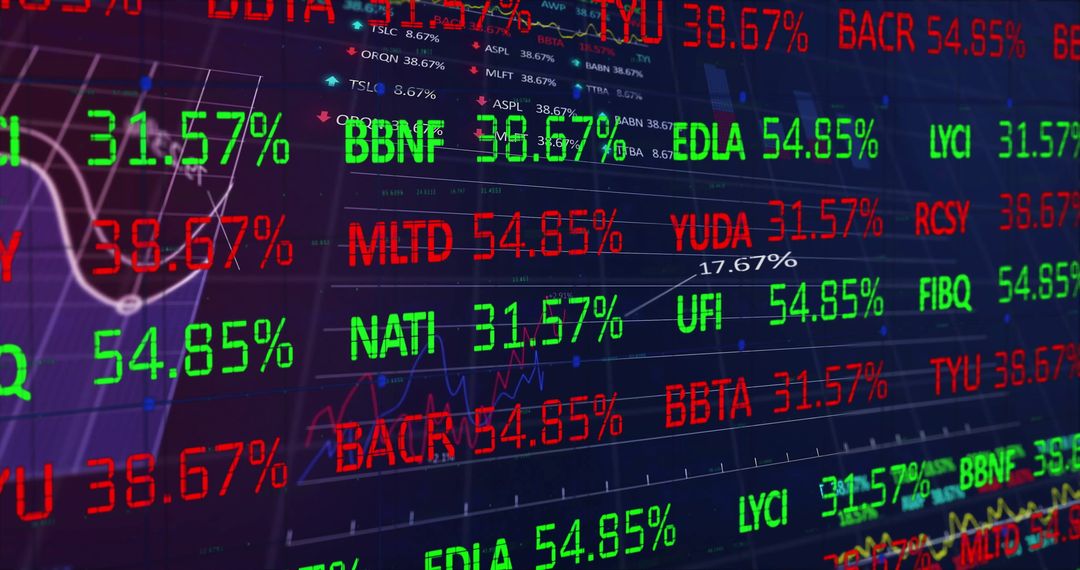
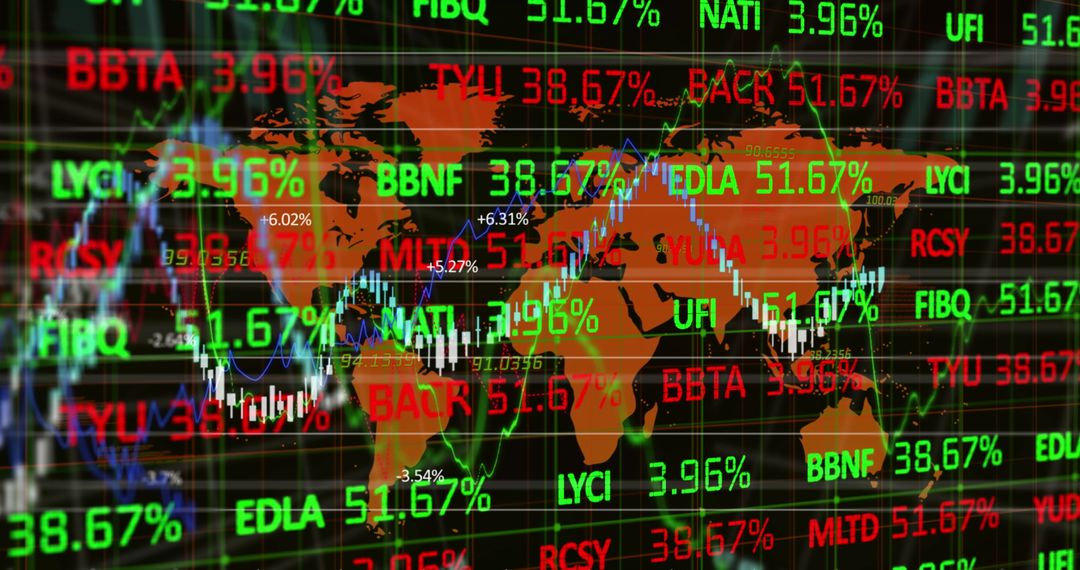
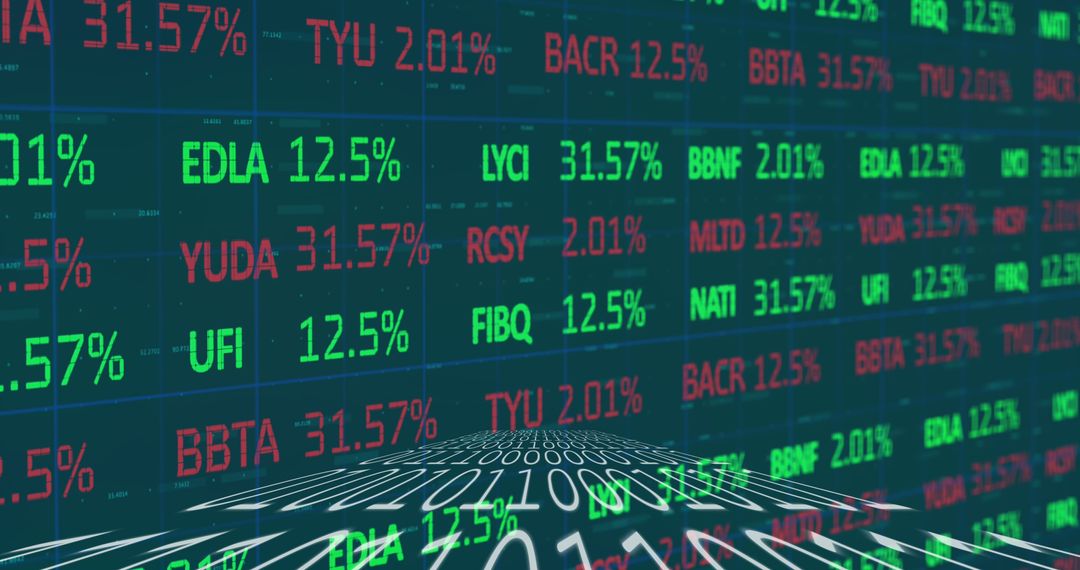
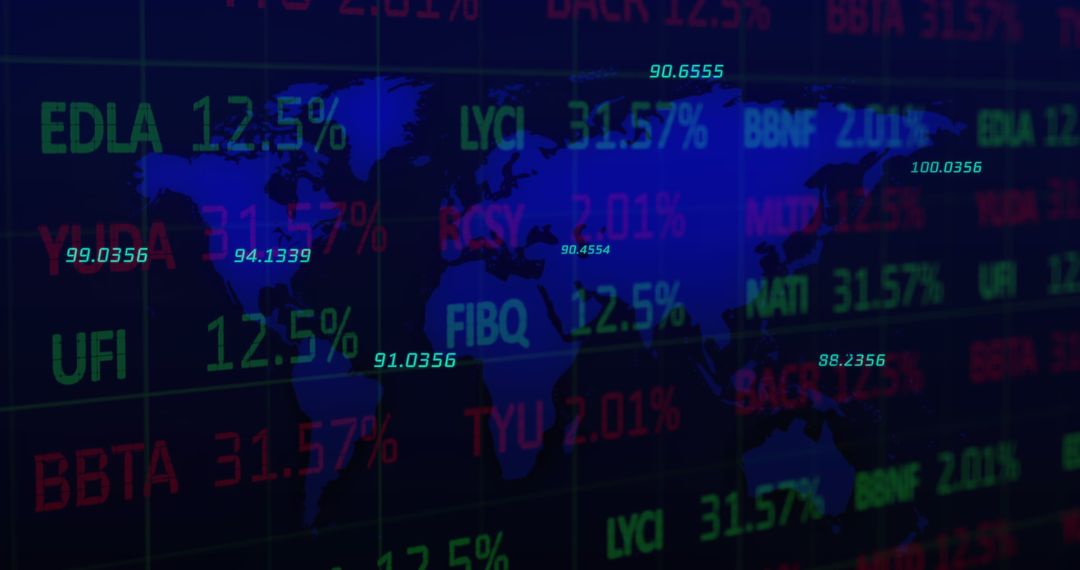
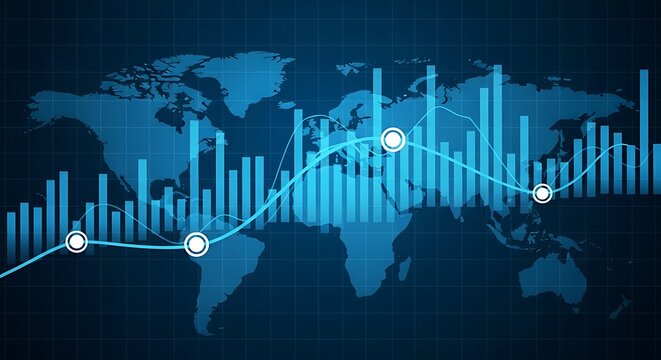
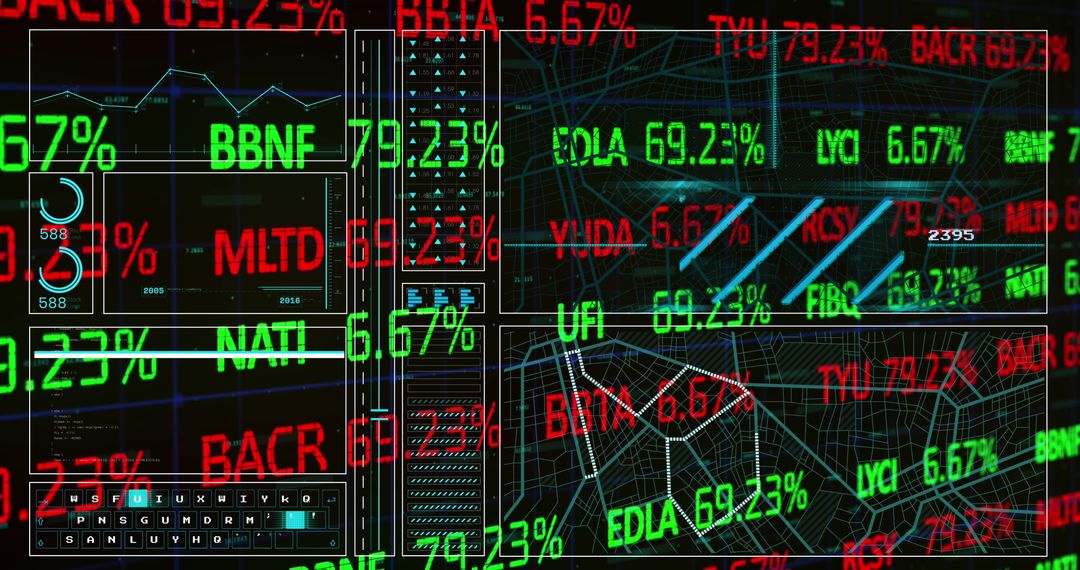
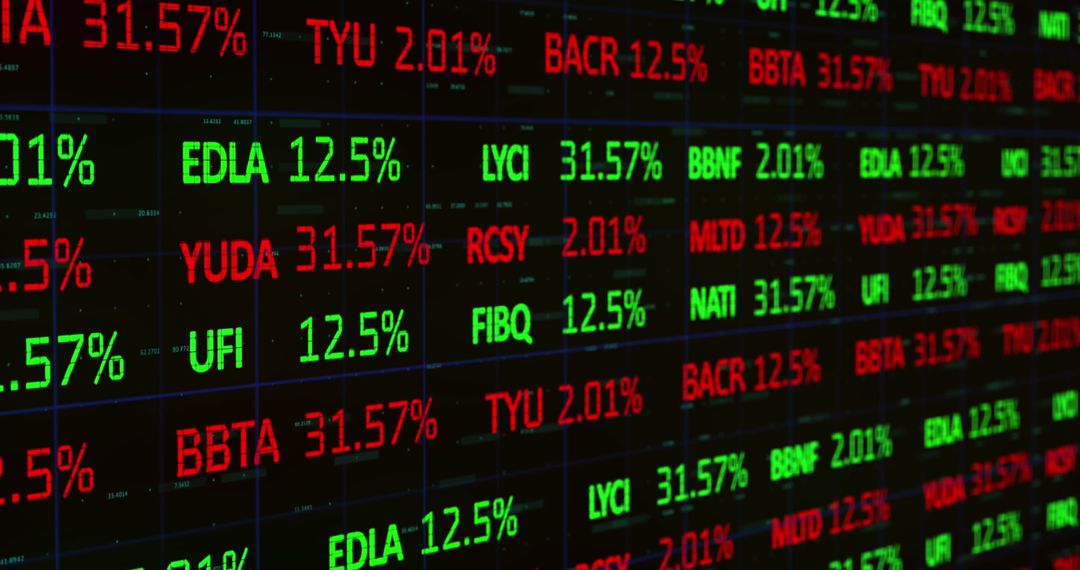
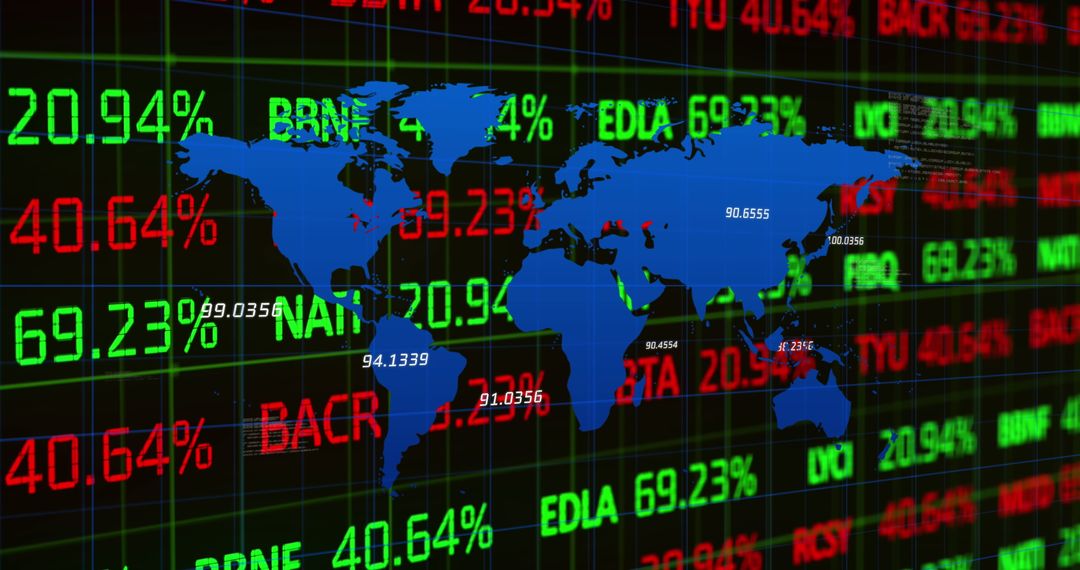
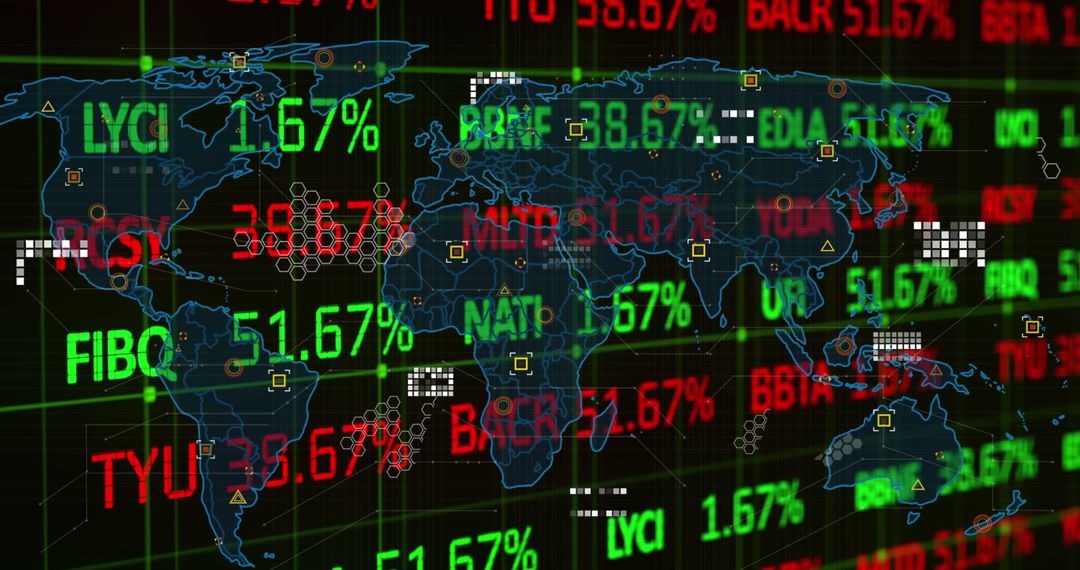
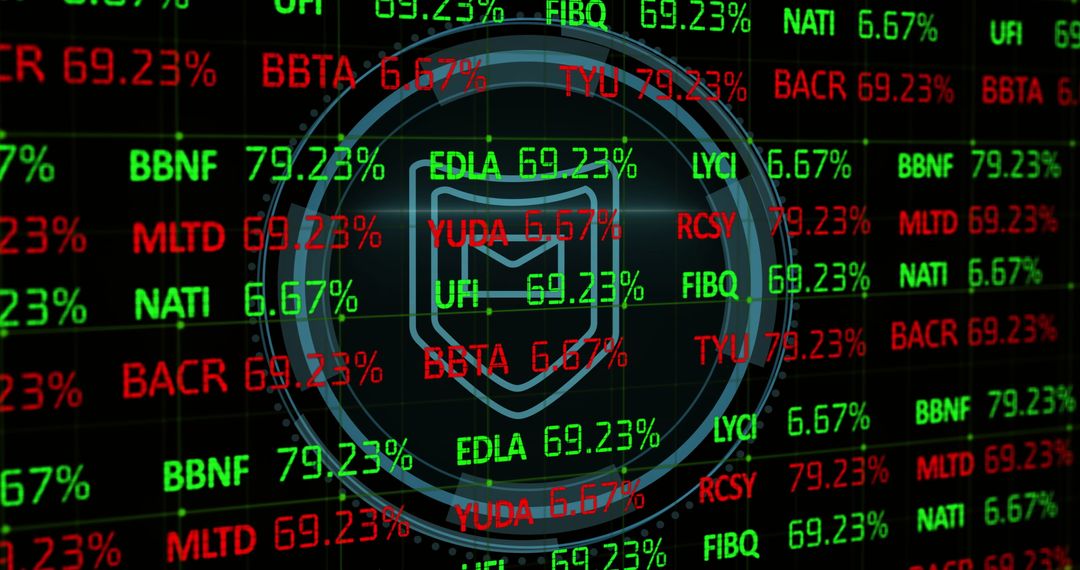
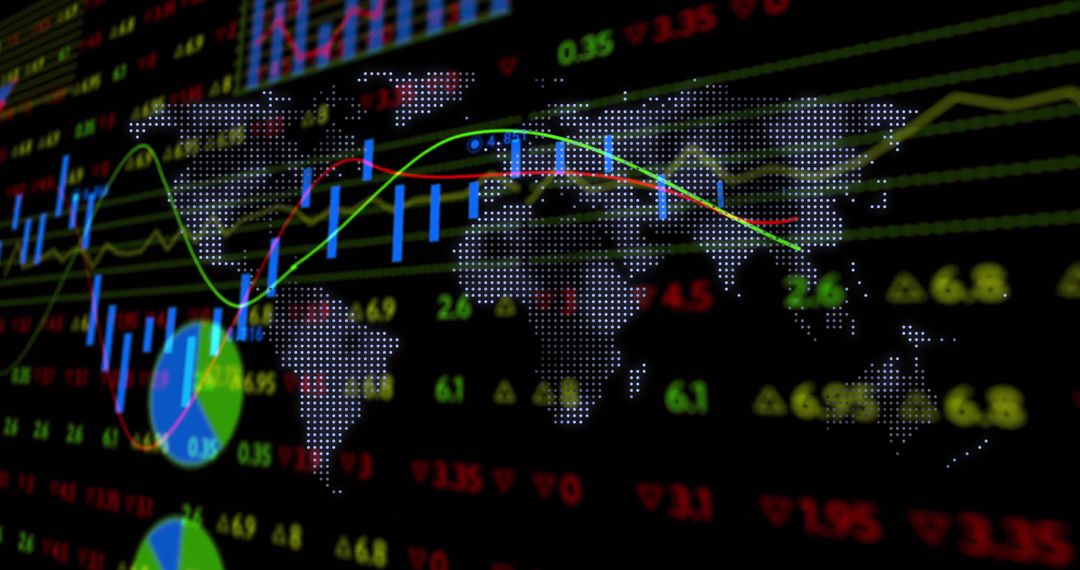
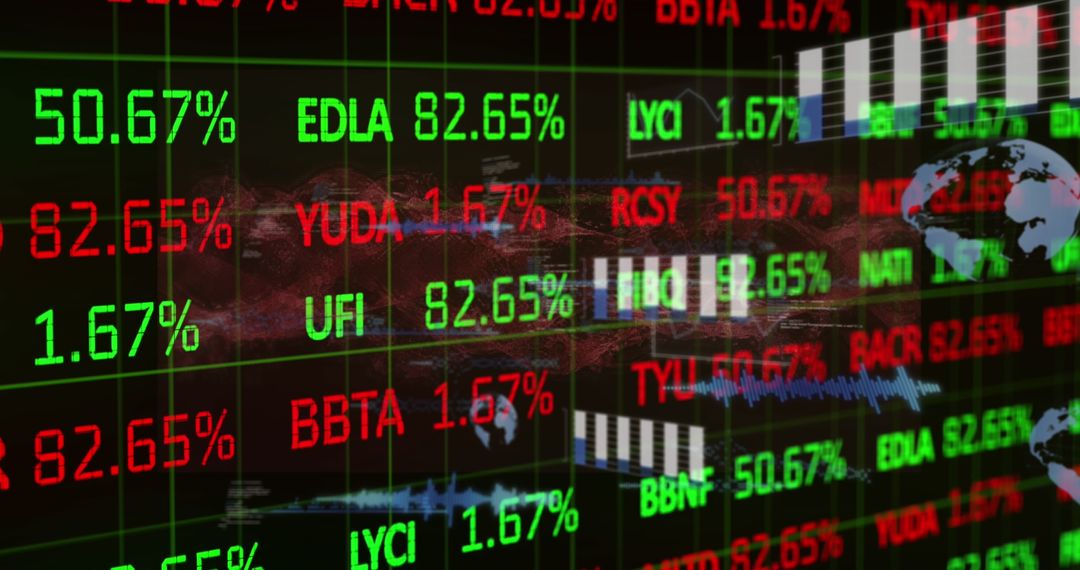
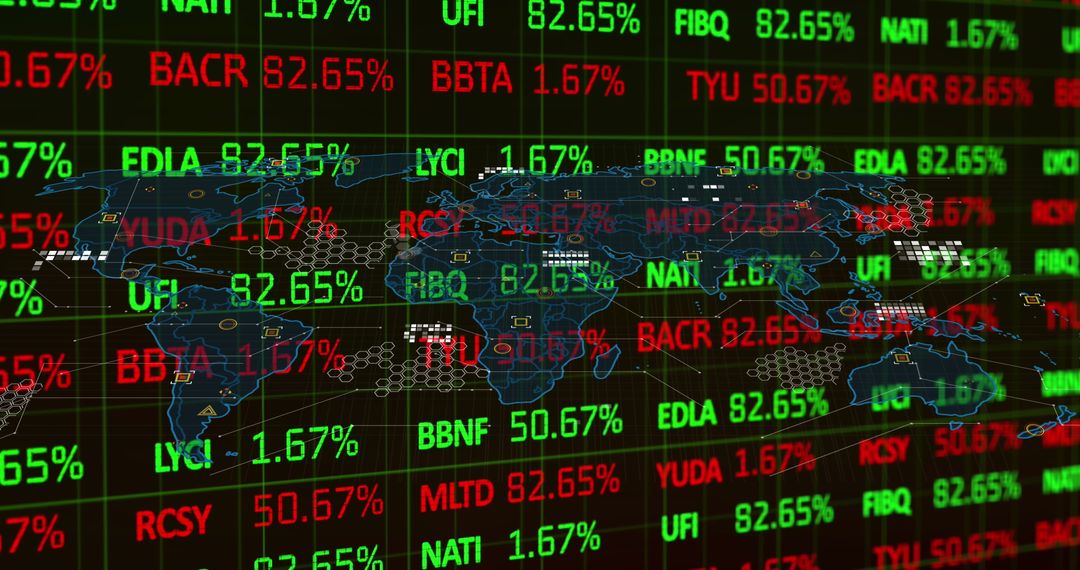
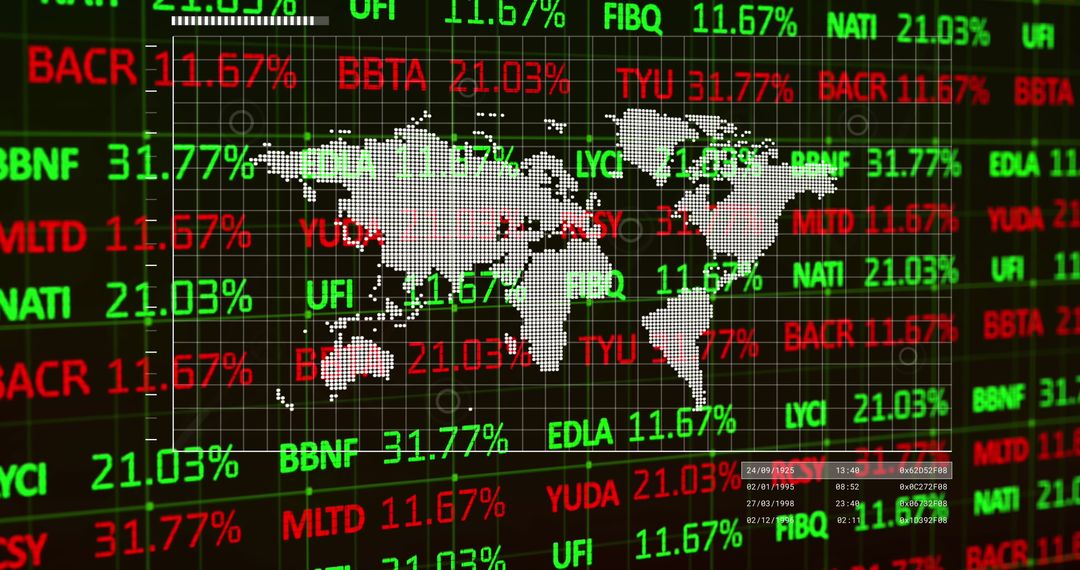
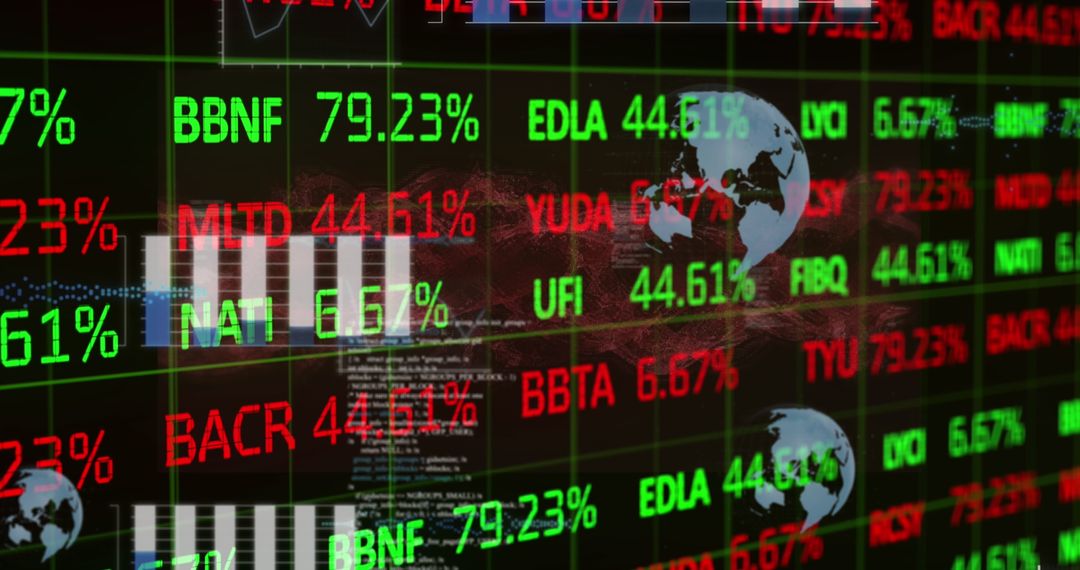
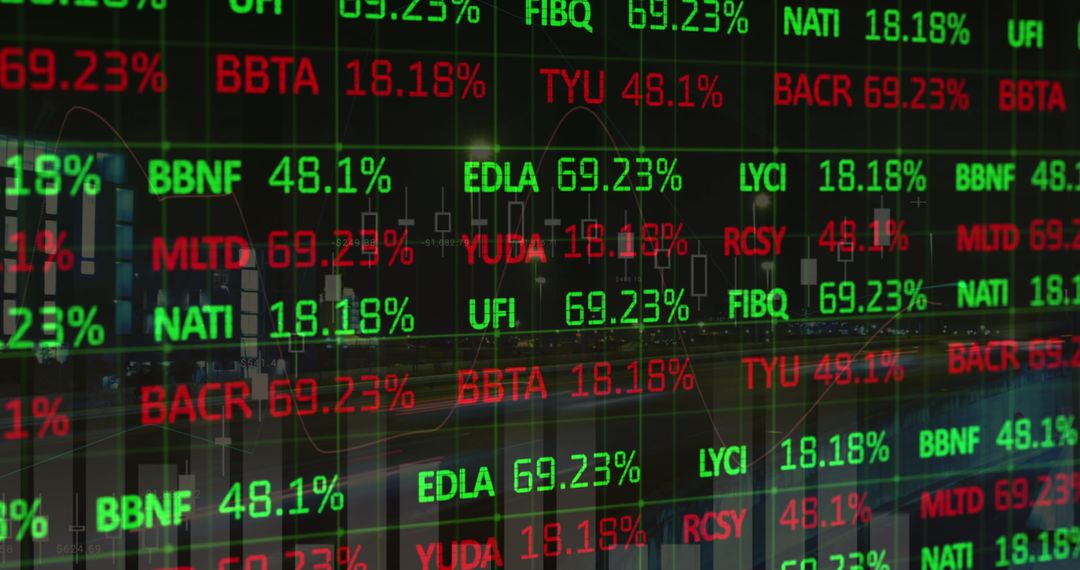
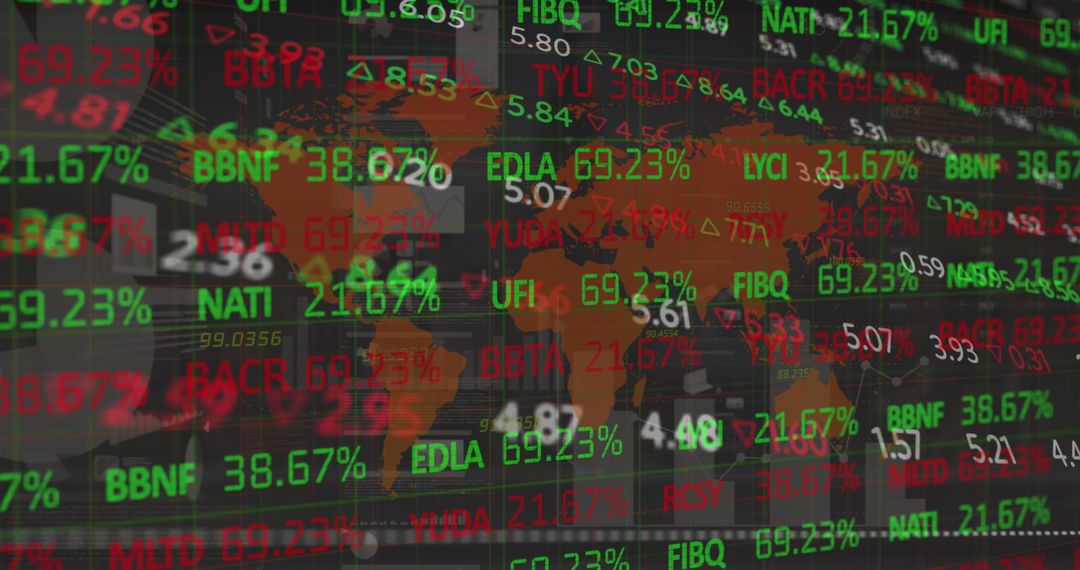
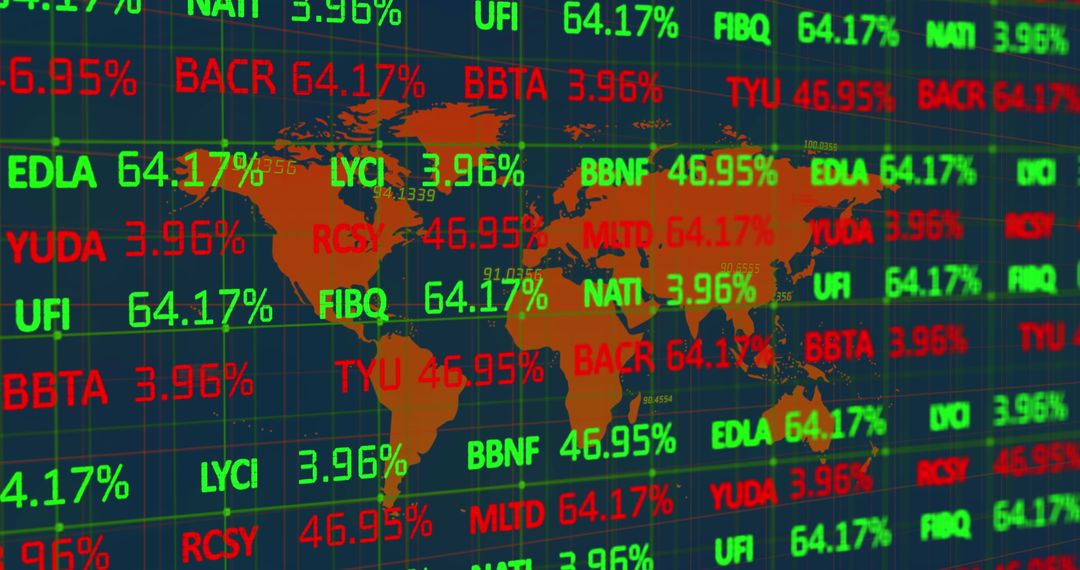
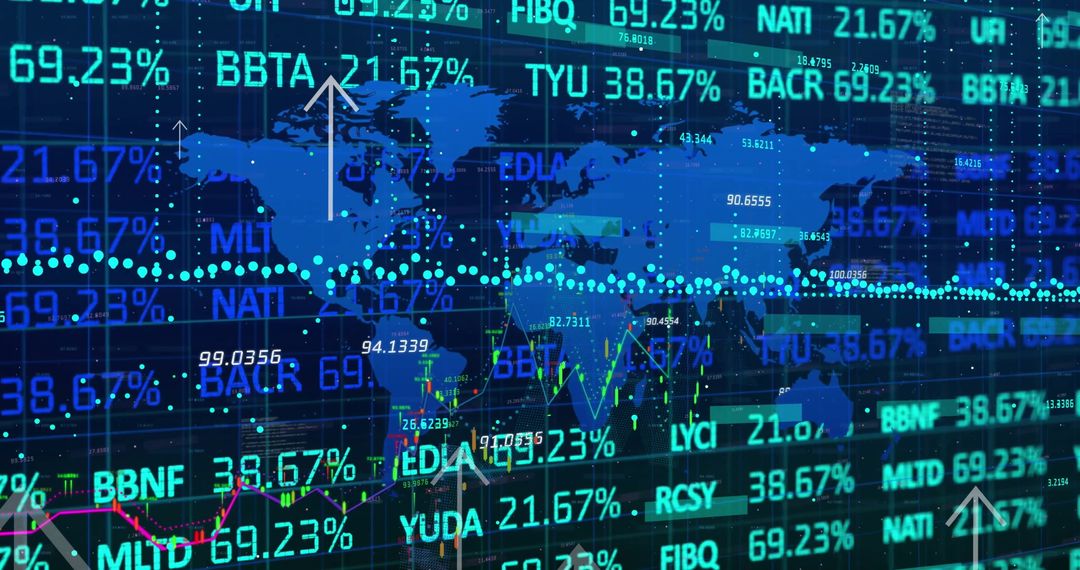
- Financial Data and Global Map for Business Analysis
Financial Data and Global Map for Business Analysis Image

Image illustrates complex financial data superimposed on a digital world map. Suitable for use in business publications, financial software backgrounds, stock market reports, and global investment newsletters. Conveys concepts of global finance, business intelligence, digital analytics, and technological advancement in economic indicators.
Powered by 


4
downloads
downloads
Tags:
More
Credit Photo
If you would like to credit the Photo, here are some ways you can do so
Text Link
photo Link
<span class="text-link">
<span>
<a target="_blank" href=https://pikwizard.com/photo/financial-data-and-global-map-for-business-analysis/14249bab95fa3a3fb852f137fc30fad1/>PikWizard</a>
</span>
</span>
<span class="image-link">
<span
style="margin: 0 0 20px 0; display: inline-block; vertical-align: middle; width: 100%;"
>
<a
target="_blank"
href="https://pikwizard.com/photo/financial-data-and-global-map-for-business-analysis/14249bab95fa3a3fb852f137fc30fad1/"
style="text-decoration: none; font-size: 10px; margin: 0;"
>
<img src="https://pikwizard.com/pw/medium/14249bab95fa3a3fb852f137fc30fad1.jpg" style="margin: 0; width: 100%;" alt="" />
<p style="font-size: 12px; margin: 0;">PikWizard</p>
</a>
</span>
</span>
Free (free of charge)
Free for personal and commercial use.
Author: Creative Art
Similar Free Stock Images
Premium


Premium


Premium


Premium


Premium


Premium


Premium

Premium

Premium


Premium

Premium


Premium


Premium


Premium
Premium


Premium


Premium


Premium


Premium


Premium


Premium

Premium

Premium


Premium