1. Home > 
  2. Stock Photos > 
  3. Financial Data and Graphs Display on Digital Interface Background

Financial Data and Graphs Display on Digital Interface Background Image

Financial Data and Graphs Display on Digital Interface Background

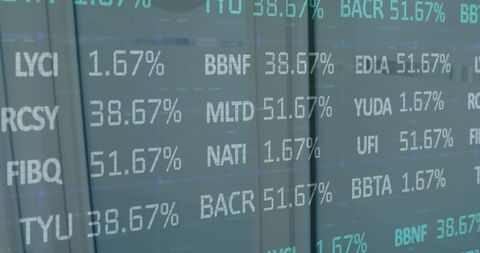
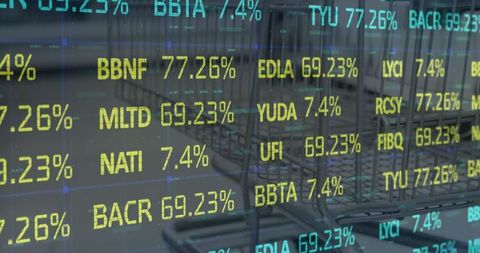
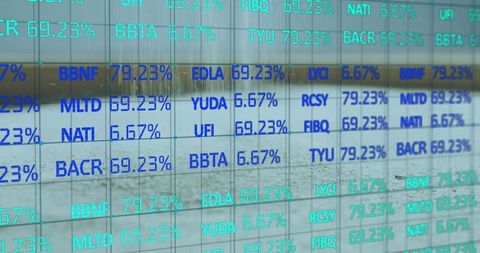
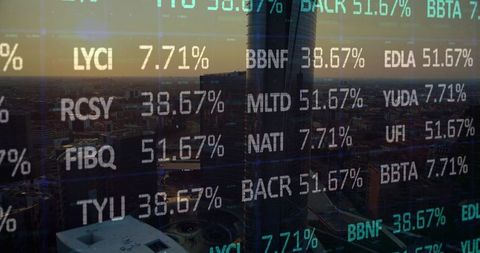
Composite features animated charts and graphs overlaying financial data, indicating real-time data analysis and performance tracking. Suitable for illustrating articles or presentations on finance trends, stock market analysis, economic forecasts, or digital innovation in banking. Ideal for use in business, finance technology, or economic academic content.

Powered by Shutterstock logo - Get 15% off with code: PIKWIZARD15
Professional analyzing financial data graphs, charts on laptop display at a modern workspace. Financial analysis or business evaluation concept - Powered by Shutterstock - Get 15% off with code: PIKWIZARD15Business, finance and investment concept. Businessman using digital tablet analyzing and calculating financial data with economic graph growth chart, Business strategy and planning. market research - Powered by Shutterstock - Get 15% off with code: PIKWIZARD15Businessman using laptop computer analyzing sales data and financial growth graph chart report. Business planning, strategy and development. Financial accounting. market research, data analysis - Powered by Shutterstock - Get 15% off with code: PIKWIZARD15Two diverse crypto traders brokers stock exchange market investors discussing trading charts research reports growth using pc computer looking at screen analyzing invest strategy, financial risks. - Powered by Shutterstock - Get 15% off with code: PIKWIZARD15Internet cyberspace data information collection analytical statistics computer storage ai artificial intelligence calculation, blue background banner copyspace. - Powered by Shutterstock - Get 15% off with code: PIKWIZARD15

Credit Photo

If you would like to credit the Photo, here are some ways you can do so

Free (free of charge)

Free for personal and commercial use.

Author: Authentic Images

Similar Free Stock Images

Digital Financial Data Displayed Over Global Map Background
Premium
Two businesspeople or an accountant team are analyzing data charts, graphs, and a dashboard on a laptop screen in order to prepare a statistical report and discuss financial data in an office
Digital Stock Market Display with Gadgets
Stock Market Data Visualization on Digital Screen
Financial Data Visualization with Urban Backdrop
Financial Data Overlaying a Cityscape Fusion
Premium
Businessman working on laptop, using mobile phone at modern office, analyzing business document with financial graph, market report on digital tablet, business data analysis concept
Financial Data Processing Overlapping Network Servers
Digital Stock Market Display in Modern Office
Dynamic Digital Stock Market Display Interface
Digital Data and Cityscape Integration for Global Business
Premium
Close view of businessman with tablet and graphs and charts on screen
Digital Data with Person Entering Office Door
Analyzing Global Stock Market Data with Digital Interface
Digital Data Projections Over Modern Cityscape
Digital Interface and Data Processing on Blue Background
Premium
Double exposure of virtual creative financial diagram on contemporary business center exterior background, banking and accounting concept
Businesswoman Analyzing Financial Data with COVID-19 Precautions
Global Stock Market Trends Across Digital Earth Concept
Financial Data Figures Overlaid on Business Team Collaboration
Asian Businesswoman Overlaid with Dynamic Stock Market Data Volumes
Premium
Magnifying glass and documents with analytics data lying on table
Digital Stock Market Data Display with Holographic Elements
Financial Data Overlay on Modern Office Building Represents Global Business Analysis
Abstract Financial Statistics Over Blue Digital Interface
Digital Finance Technology Interface Over Retail Shop Interior
Premium
Stockmarket online trading chart candlestick on crypto currency platform. Stock exchange financial market price candles graph data pattern analysis concept. Computer screen closeup background
Digital Financial Data Overlay in Empty Modern Office
Holographic Trading Digital Interface with Data Overlay
Futuristic Digital Display with Alphanumeric Codes and Percentages
Data Center Reflection with Code Overlay and LED Indicators
High-Tech Data Analytics with Overlaid Virtual Charts
Digital Data Processing Over Computer Servers Interface
Premium
Abstract glowing big data forex candlestick chart on blurry city backdrop. Trade, technology, investment and analysis concept. Double exposure
Global Data Processing and Digital Interface Over World Map
Digital Financial Data Overlay on Business Professionals at HQ
Stock Market Data Display with Team Analysis in Office Background
Global Business Finances on Digital Map
Premium
Analysis finance grow graph and market  investment. Financial  business plan,earnings,sale and strategy. Stock market chart, exchange financial growth diagram.
Global Financial Data Processing and Statistics Visualization
Digital Display with Percentage Values Overlayed on World Map
Digital Financial Analysis Over Cityscape Scene
Digital Interface Displaying Real-Time Financial Data
Premium
Businessman using KPI dashboard.Financial business KPI System data analytics graph dashboard.Data System KPI and metrics connected in database for follow earnings,operations and sales data.
Stock Market Data Analysis on Digital Screen
Dynamic Data Visualization on Digital Screens Amidst Mosaic Patterns
Dynamic Financial Data on Glowing Digital Screen
Digital Interface With Cryptocurrency Data Overlay
Premium
Stock market or forex trading graph on touchscreen,  finance and investment concept. Economy trends for business, financial charts and digits.
Futuristic Stock Market Data with Digital Globe Overlay
Global Stock Market Display with Businessman in Office Overlay
Financial Data Overlaid on Digital Background for Global Markets
Dynamic Stock Market Analysis on Blue Digital Display
Premium
Finance, banking and investment, Asset allocation, budget management. Business woman calculating financial report, cost control and budgeting with business data graph growth chart. Tax and budgeting
Blurred Stock Market Display Overlapping City Skyline
Financial Data with Digital Interface and Circular Design
Digital Financial Data Overlay and Retail Connection
Interactive Digital Financial Data Display in Shopping Setting
Premium
3D blue bar graph rising, sotck market informations
Financial Data Overlay with Cityscape Background Visualizing Economic Trends
Cylindrical Skyscraper Over Urban Sunset with Digital Stock Overlay
Teamwork and Financial Analysis Strategies in Corporate Setting
Financial Data Visualization on Digital Blue Background
Digital Stock Market Data Overlaying Urban Cityscape
Stock Market Data Interface Analyzing Global Economy
Premium
business documents on office table with smart phone and laptop computer and graph financial with social network diagram and three colleagues discussing data in the background
Digital Transformation Overlapping 5G Data and Financial Graphs Synergy
Global Financmial Data Visualization on World Map
Digital Financial Data with Percentages on Screen
Financial Data Streams on Digital Interface
Premium
Businesswoman analyzing financial data at her desk, she checks charts and graphs showing economic growth, focusing on investment trends and marketing strategies in modern office.
Falling Dollar Sign Represents Global Financial Instability
Digital Data Overlay on Urban Skyline Visualizing Global Finance
Abstract Stock Market Data Technology Background
Digital Stock Market Data Visualization in Blue
Premium
Financial advisor explaining invest stock market data consulting investor. Two busy business men analysts doing finance trading analysis pointing at exchange chart on laptop screen working in office.
Binary Code Overlay on Financial Data and Cityscape
Global Financial Data Processing with Digital Connections
Digital Financial Data Overlay in Modern Office Environment
Stock Market Analyzed Against Urban Landscape
Premium
Data analysis, business meeting or woman with graph presentation in office for revenue, profit or sale statistics. Chart, analytics or accounting mentor brainstorming economy, inflation or solution
Interactive Stock Market Visualization in Office Setting
Financial Data Analytics Overlay on Computer Desk with Global Map
Global Data Analysis Concepts with Digital Interface Over Map
Stock Market Data Overlay with Businesswoman in Background
Premium
Businessman analyzing forex trading graph financial data. Stock Market Investments Funds and Digital Assets. Business finance technology and investment concept. Business finance background.
Global Financial Data Analysis with World Map Overlay and Percent Symbols
Digital Financial Data on Glass Display over Notepad
Financial Data Overlay on City Skyline Depicting Global Business
Businesswoman Analyzing Stock Market Data on Digital Interface
Premium
Big data technology and data science. Data scientist querying, analysing and visualizing complex set on virtual screen. Data flow concept. Neural network, artificial intelligence, ML, analytics.
Digital Financial Charts on Skyscraper with Statistics
Data center server racks showing console overlays with redacted entries and blue light
Abstract Financial Data Charts on Digital Interface Background
Binary Code and Digital Data Over Globe
Finance Graph Over Digital Interface with Basic Shapes and Numbers
Digital World Map with Global Financial Technology
Premium
Analyst working with Financial Data and Business Analytics Dashboard on computer to make Financial Report with KPI and Metrics. Investment, Corporate Finance, Strategy, Operations, Sales.
Stacks of Coins with Digital Financial Data Overlay
Financial Data Processing Overlaid on Server Room Background
Financial Data Overlay on Shopping Environment Concept
Dynamic Financial Data Display with Real-Time Statistics
Premium
Business graphs and charts on table. Financial development, Banking Account, Statistics
Digital Financial Data Analysis with Graph Elements
Digital Financial Data with Graphical Analysis Overlay
Digital Display of Financial Data in Vibrant Colors Reflecting Stock Exchange Trends
Digital Data Holographic Interfaces with Stock Exchange Figures
Premium
African American woman analyzing financial data on laptop screen in hybrid office setting for digital entrepreneurship KPI dashboard.
Financial Data Processing with Graphs and Numbers
Global Financial Technology Interface with Digital Connections
Abstract Digital Financial Graph with Global Business Data
Global Stock Market Data Integrated with Digital World
Premium
Finance analyst working on business analytics and data management system to make financial report with business performance, KPI dashboard. Corporate strategy for finance, digital marketing plan
Dynamic Stock Market Data with Digital Interface Concept
Dynamic Stock Market Data and Statistical Analytics Concepts
Businesswoman Analyzing Financial Market Data with Abstract Overlay
Businesswoman Analyzing Financial Data Amid Digital Display
Premium
abstract Financial chart with moving up growing stock market graph in blue light color background
Financial Data Overlay on Shopping Mall Interiors
Digital Finance Stock Market Data Overlay with Global Connections
Digital Stock Market Grid Display Showcasing Real-Time Financial Data
Financial Graph Illustrating Data Trends on Digital Screen
Premium
Stock market or forex trading graph in futuristic concept suitable for financial investment or Economic trends business idea and all art work design. Abstract finance background
Encrypted Server Aisle Concept Datacenter Security Visualization with Code and Hex Overlay