
- Home >
- Stock Photos >
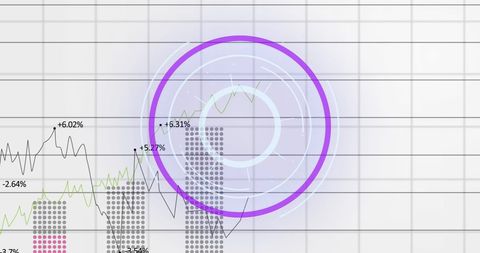
- Financial Data and Graphs with Futuristic Interface
Financial Data and Graphs with Futuristic Interface Image

This visual depicts dynamic financial data rendered alongside advanced graphical elements, emphasizing technology's role in modern business analytics. Useful for illustrating concepts of global finance, predictive market analysis, or corporate computing reports.
Powered by  - Get 15% off with code: PIKWIZARD15


downloads
Tags:
More
Credit Photo
If you would like to credit the Photo, here are some ways you can do so
Text Link
photo Link
<span class="text-link">
<span>
<a target="_blank" href=https://pikwizard.com/photo/financial-data-and-graphs-with-futuristic-interface/d6711db6031696124c3d4e4f126d2a45/>PikWizard</a>
</span>
</span>
<span class="image-link">
<span
style="margin: 0 0 20px 0; display: inline-block; vertical-align: middle; width: 100%;"
>
<a
target="_blank"
href="https://pikwizard.com/photo/financial-data-and-graphs-with-futuristic-interface/d6711db6031696124c3d4e4f126d2a45/"
style="text-decoration: none; font-size: 10px; margin: 0;"
>
<img src="https://pikwizard.com/pw/medium/d6711db6031696124c3d4e4f126d2a45.jpg" style="margin: 0; width: 100%;" alt="" />
<p style="font-size: 12px; margin: 0;">PikWizard</p>
</a>
</span>
</span>
Free (free of charge)
Free for personal and commercial use.
Author: Creative Art
Similar Free Stock Images

Premium


Premium


Premium


Premium

Premium


Premium

Premium


Premium


Premium


Premium


Premium


Premium


Premium


Premium


Premium

Premium

Premium


Premium


Premium


Premium


Premium


Premium


Premium


Premium

Premium


Explore More Free Stock Images