- Home >
- Stock Photos >
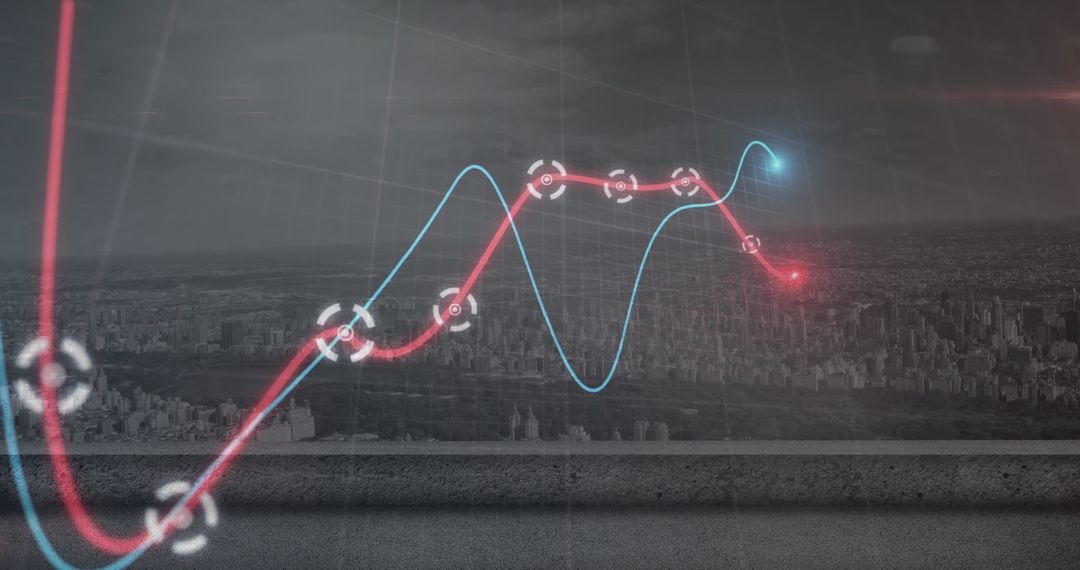
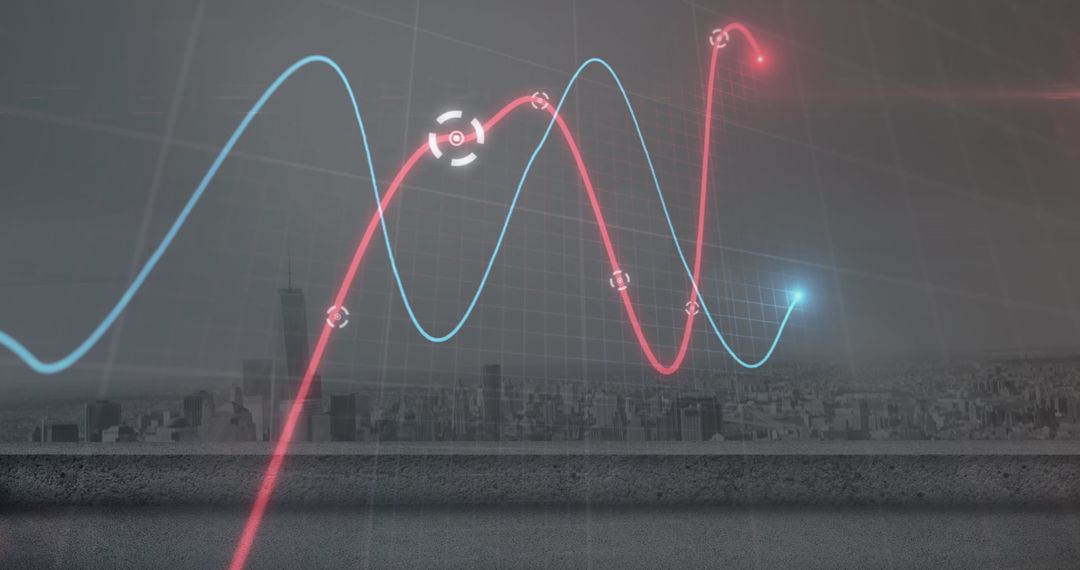
- Financial Data and Growth Chart in Urban Skyline
Financial Data and Growth Chart in Urban Skyline Image

This digital composition showcases a fluctuating financial growth chart set against an urban cityscape, symbolizing the connection between business trends and urban environments. Useful for illustrating articles or presentations related to finance, urban economic growth, technology in business analyses, and global economic trends.
Powered by 


2
downloads
downloads
Tags:
More
Credit Photo
If you would like to credit the Photo, here are some ways you can do so
Text Link
photo Link
<span class="text-link">
<span>
<a target="_blank" href=https://pikwizard.com/photo/financial-data-and-growth-chart-in-urban-skyline/016c8b8dc1fac29c9e4550b45982d7f3/>PikWizard</a>
</span>
</span>
<span class="image-link">
<span
style="margin: 0 0 20px 0; display: inline-block; vertical-align: middle; width: 100%;"
>
<a
target="_blank"
href="https://pikwizard.com/photo/financial-data-and-growth-chart-in-urban-skyline/016c8b8dc1fac29c9e4550b45982d7f3/"
style="text-decoration: none; font-size: 10px; margin: 0;"
>
<img src="https://pikwizard.com/pw/medium/016c8b8dc1fac29c9e4550b45982d7f3.jpg" style="margin: 0; width: 100%;" alt="" />
<p style="font-size: 12px; margin: 0;">PikWizard</p>
</a>
</span>
</span>
Free (free of charge)
Free for personal and commercial use.
Author: Awesome Content
Similar Free Stock Images

Premium


Premium


Premium


Premium


Premium


Premium


Premium


Premium


Premium


Premium


Premium


Premium


Premium


Premium


Premium


Premium


Premium


Premium


Premium


Premium


Premium


Premium


Premium


Premium