- Home >
- Stock Photos >
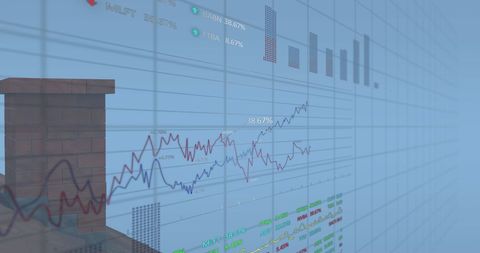
- Financial Data and Growth Charts in Modern Office Space
Financial Data and Growth Charts in Modern Office Space Image

Visual depicting financial data projections and growth trends superimposed on a modern office background. Ideal for illustrating financial reports, investment strategies, corporate presentations, and articles focusing on statistics and economic analysis. Offers a tech-driven perspective on business trends and futuristic office environments.
Powered by  - Get 15% off with code: PIKWIZARD15


2
downloads
downloads
Tags:
More
Credit Photo
If you would like to credit the Photo, here are some ways you can do so
Text Link
photo Link
<span class="text-link">
<span>
<a target="_blank" href=https://pikwizard.com/photo/financial-data-and-growth-charts-in-modern-office-space/7635c4584cd4804d09fb1dbc4c47bb49/>PikWizard</a>
</span>
</span>
<span class="image-link">
<span
style="margin: 0 0 20px 0; display: inline-block; vertical-align: middle; width: 100%;"
>
<a
target="_blank"
href="https://pikwizard.com/photo/financial-data-and-growth-charts-in-modern-office-space/7635c4584cd4804d09fb1dbc4c47bb49/"
style="text-decoration: none; font-size: 10px; margin: 0;"
>
<img src="https://pikwizard.com/pw/medium/7635c4584cd4804d09fb1dbc4c47bb49.jpg" style="margin: 0; width: 100%;" alt="" />
<p style="font-size: 12px; margin: 0;">PikWizard</p>
</a>
</span>
</span>
Free (free of charge)
Free for personal and commercial use.
Author: Authentic Images
Similar Free Stock Images
Loading...

Premium


Premium


Premium


Premium


Premium

Premium


Premium


Premium


Premium


Premium


Premium

Premium


Premium


Premium


Premium


Premium


Premium


Premium

Premium


Premium


Premium


Premium


Premium


Premium


Premium