
- Home >
- Stock Photos >
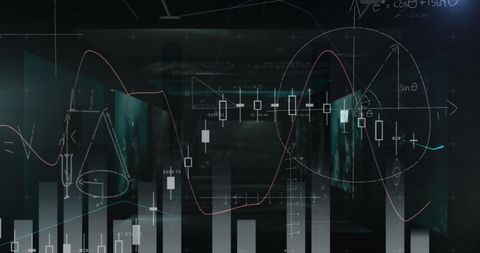
- Financial Data and Math Equations on Digital Screen Interface
Financial Data and Math Equations on Digital Screen Interface Image
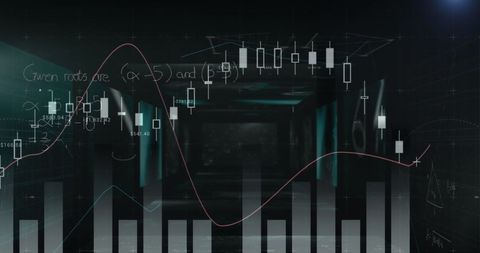
The visual of complex mathematical equations overlaid with financial graphs on digital screens symbolizes data processing in business technology. It is ideal for illustrating concepts of analytics, market research, or technology integration. Useful for websites, presentations, or marketing materials in the finance and tech industries, emphasizing growth and innovation.
Powered by 


downloads
Tags:
More
Credit Photo
If you would like to credit the Photo, here are some ways you can do so
Text Link
photo Link
<span class="text-link">
<span>
<a target="_blank" href=https://pikwizard.com/photo/financial-data-and-math-equations-on-digital-screen-interface/8a2f14462a6b8c86b3945f91ea827789/>PikWizard</a>
</span>
</span>
<span class="image-link">
<span
style="margin: 0 0 20px 0; display: inline-block; vertical-align: middle; width: 100%;"
>
<a
target="_blank"
href="https://pikwizard.com/photo/financial-data-and-math-equations-on-digital-screen-interface/8a2f14462a6b8c86b3945f91ea827789/"
style="text-decoration: none; font-size: 10px; margin: 0;"
>
<img src="https://pikwizard.com/pw/medium/8a2f14462a6b8c86b3945f91ea827789.jpg" style="margin: 0; width: 100%;" alt="" />
<p style="font-size: 12px; margin: 0;">PikWizard</p>
</a>
</span>
</span>
Free (free of charge)
Free for personal and commercial use.
Author: Awesome Content
Similar Free Stock Images

Premium


Premium


Premium

Premium


Premium

Premium


Premium


Premium


Premium


Premium


Premium


Premium

Premium


Premium


Premium

Premium


Premium


Premium

Premium


Premium


Premium

Premium


Premium

Premium


Premium


Explore More Free Stock Images