- Home >
- Stock Photos >
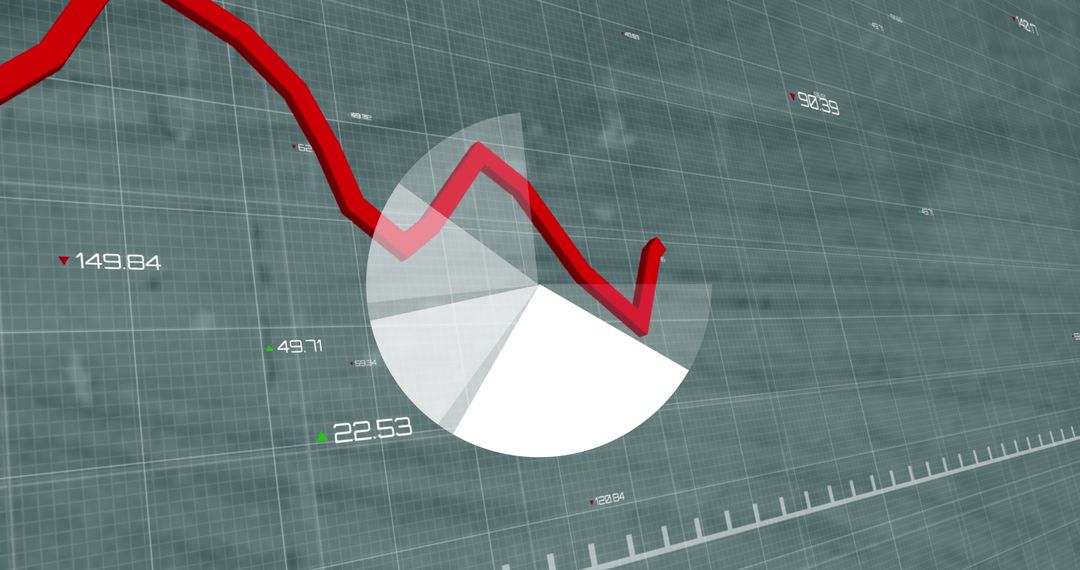
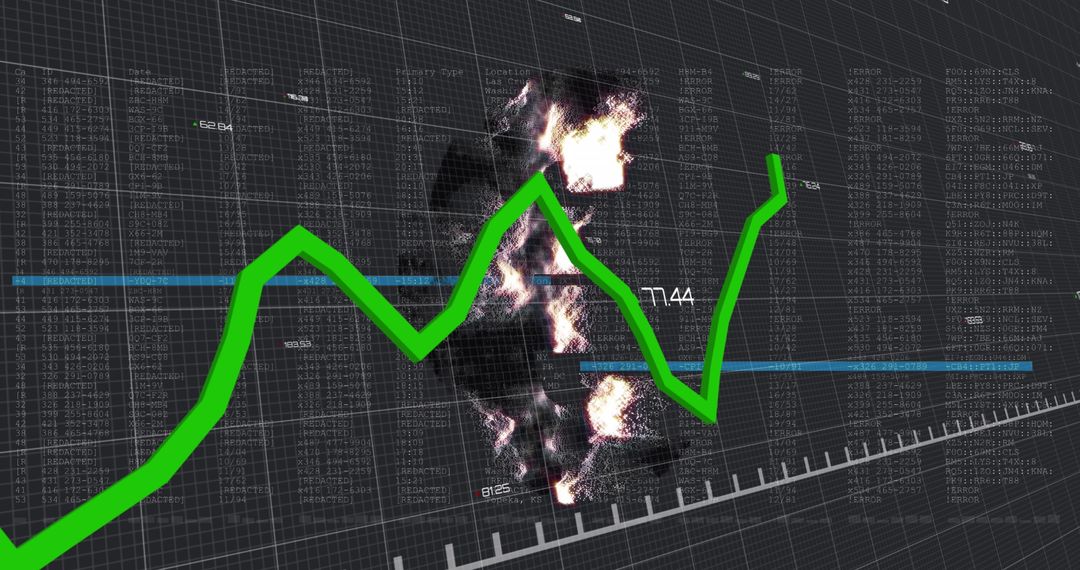
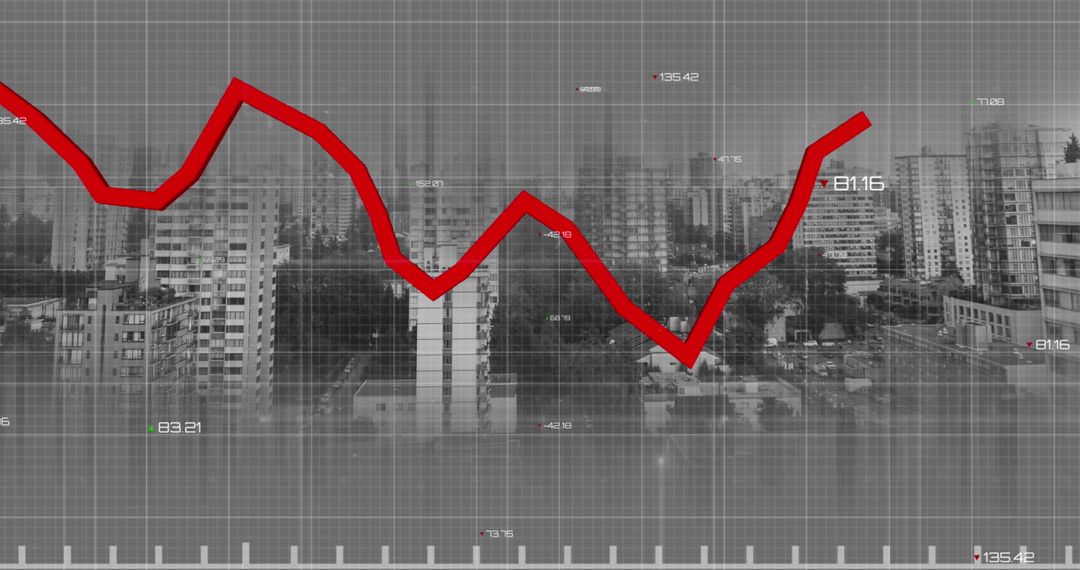
- Financial Data and Moonlit Cityscape Fusing Global Business Insights
Financial Data and Moonlit Cityscape Fusing Global Business Insights Image

A blend of financial graphs against cityscape and full moon outlines the crossover of data analytics and urban business environment. Useful for financial articles, business strategy workshops, or presentations displaying economic growth influenced by urban settings.
Powered by  - Get 15% off with code: PIKWIZARD15


2
downloads
downloads
Tags:
More
Credit Photo
If you would like to credit the Photo, here are some ways you can do so
Text Link
photo Link
<span class="text-link">
<span>
<a target="_blank" href=https://pikwizard.com/photo/financial-data-and-moonlit-cityscape-fusing-global-business-insights/09d49981bd540f976e8011082a85dc1e/>PikWizard</a>
</span>
</span>
<span class="image-link">
<span
style="margin: 0 0 20px 0; display: inline-block; vertical-align: middle; width: 100%;"
>
<a
target="_blank"
href="https://pikwizard.com/photo/financial-data-and-moonlit-cityscape-fusing-global-business-insights/09d49981bd540f976e8011082a85dc1e/"
style="text-decoration: none; font-size: 10px; margin: 0;"
>
<img src="https://pikwizard.com/pw/medium/09d49981bd540f976e8011082a85dc1e.jpg" style="margin: 0; width: 100%;" alt="" />
<p style="font-size: 12px; margin: 0;">PikWizard</p>
</a>
</span>
</span>
Free (free of charge)
Free for personal and commercial use.
Author: Creative Art
Similar Free Stock Images

Premium


Premium


Premium


Premium


Premium


Premium


Premium