
- Home >
- Stock Photos >
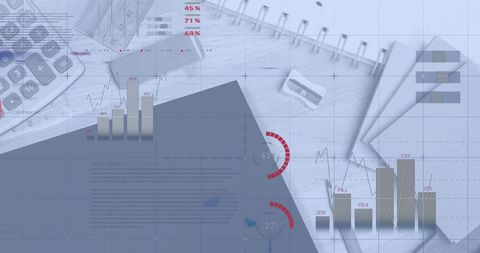
- Financial Data and Network Technology Overlay
Financial Data and Network Technology Overlay Image

Financial data combined with digital network visuals illustrating advanced technology and connectivity concepts. Useful for presentations on global market trends, financial analytics, and technology integration in business contexts. Perflect choice for publications discussing stock market insights and fostering understanding of digital trading systems.
Powered by 


downloads
Tags:
More
Credit Photo
If you would like to credit the Photo, here are some ways you can do so
Text Link
photo Link
<span class="text-link">
<span>
<a target="_blank" href=https://pikwizard.com/photo/financial-data-and-network-technology-overlay/8719ecb7e958cc760cf95dc52246de24/>PikWizard</a>
</span>
</span>
<span class="image-link">
<span
style="margin: 0 0 20px 0; display: inline-block; vertical-align: middle; width: 100%;"
>
<a
target="_blank"
href="https://pikwizard.com/photo/financial-data-and-network-technology-overlay/8719ecb7e958cc760cf95dc52246de24/"
style="text-decoration: none; font-size: 10px; margin: 0;"
>
<img src="https://pikwizard.com/pw/medium/8719ecb7e958cc760cf95dc52246de24.jpg" style="margin: 0; width: 100%;" alt="" />
<p style="font-size: 12px; margin: 0;">PikWizard</p>
</a>
</span>
</span>
Free (free of charge)
Free for personal and commercial use.
Author: Authentic Images
Similar Free Stock Images

Premium

Premium

Premium


Premium


Premium


Premium


Premium


Premium


Premium


Premium


Premium


Premium


Premium

Premium


Premium


Premium

Premium


Premium


Premium


Premium

Premium


Premium

Premium


Premium


Premium

Explore More Free Stock Images