
- Home >
- Stock Photos >
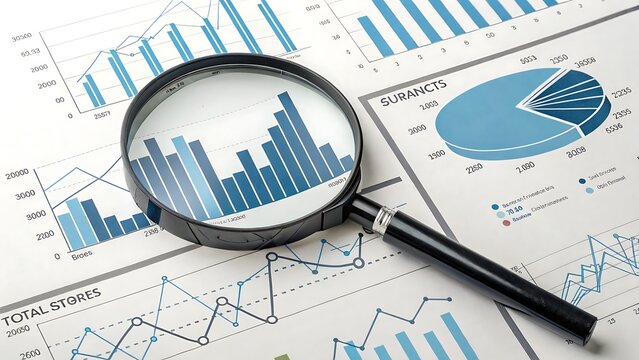
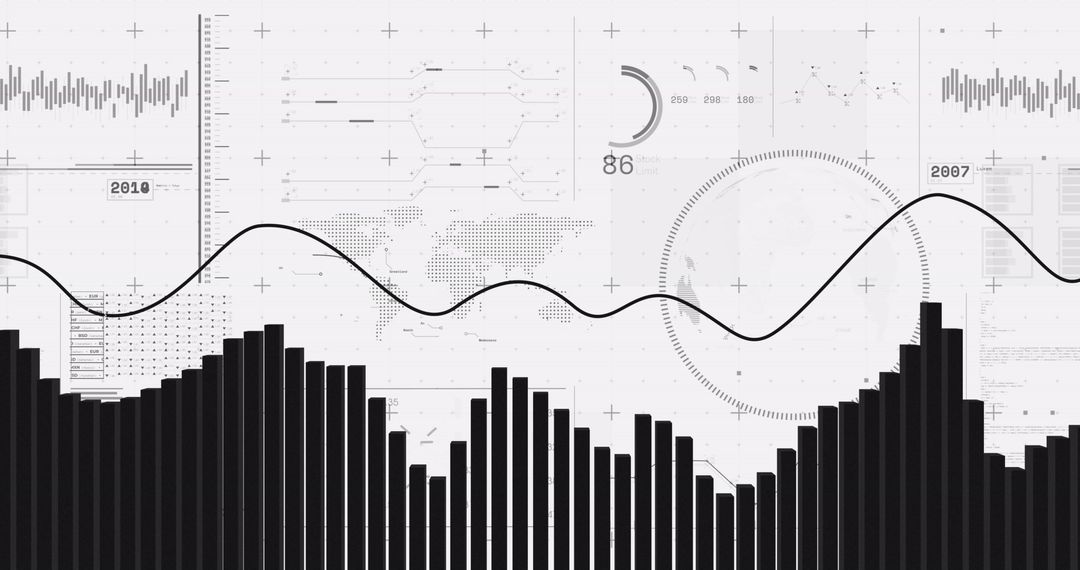
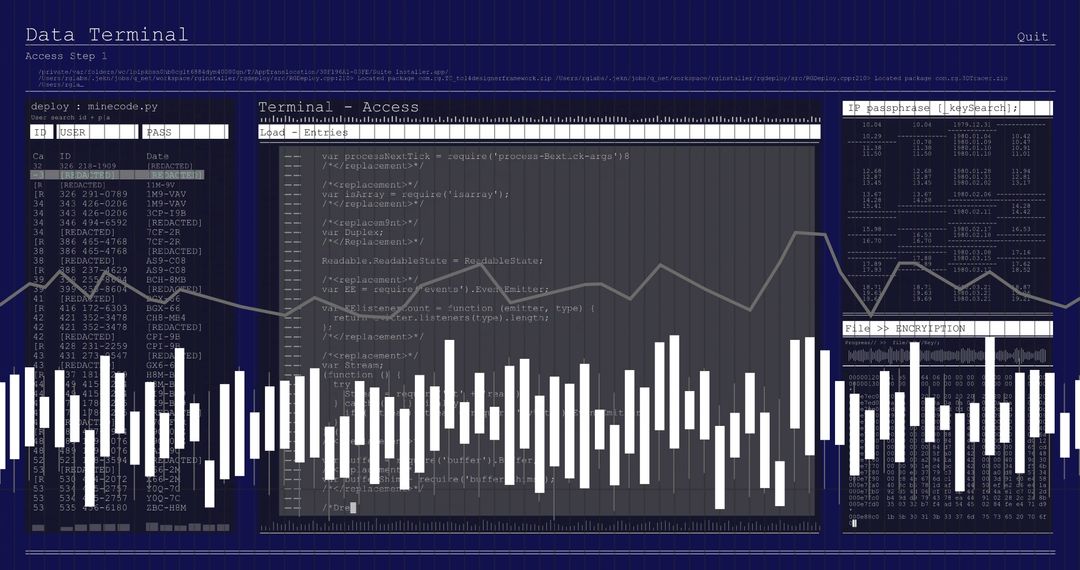
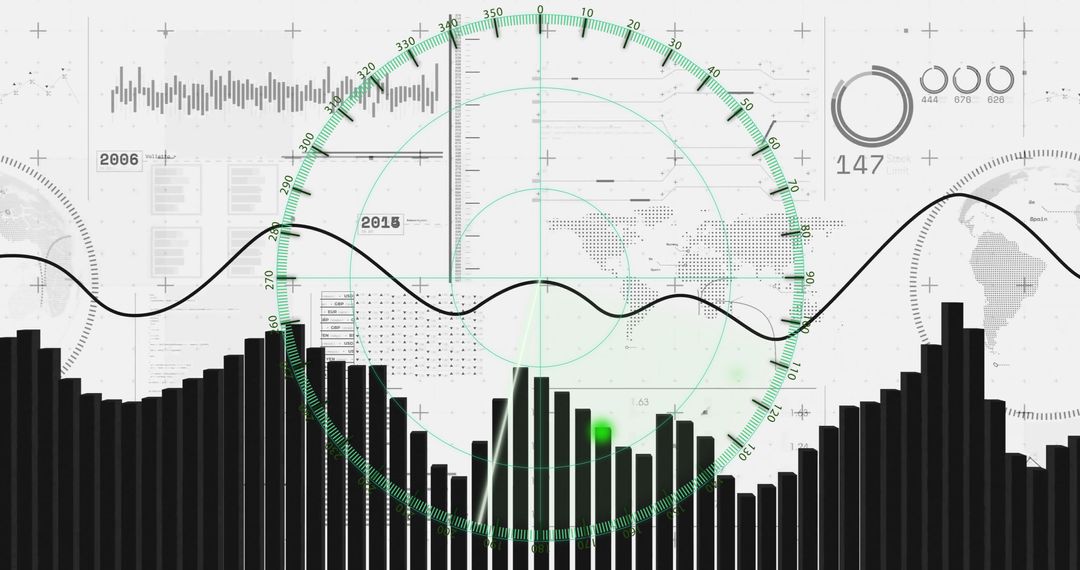
- Financial Data and Risk Management Analysis in Global Context
Financial Data and Risk Management Analysis in Global Context Image

Visual represents conceptualized financial data analysis with digital interface elements, focusing on global business and technology dynamics. Ideal for illustrating modern finance, business analytics, risk assessment tools, or digital economy topics within presentations, reports, or articles concerning economic trends and data visualization techniques.
Powered by 


2
downloads
downloads
Tags:
More
Credit Photo
If you would like to credit the Photo, here are some ways you can do so
Text Link
photo Link
<span class="text-link">
<span>
<a target="_blank" href=https://pikwizard.com/photo/financial-data-and-risk-management-analysis-in-global-context/139f9631f09781691d8078de7be08259/>PikWizard</a>
</span>
</span>
<span class="image-link">
<span
style="margin: 0 0 20px 0; display: inline-block; vertical-align: middle; width: 100%;"
>
<a
target="_blank"
href="https://pikwizard.com/photo/financial-data-and-risk-management-analysis-in-global-context/139f9631f09781691d8078de7be08259/"
style="text-decoration: none; font-size: 10px; margin: 0;"
>
<img src="https://pikwizard.com/pw/medium/139f9631f09781691d8078de7be08259.jpg" style="margin: 0; width: 100%;" alt="" />
<p style="font-size: 12px; margin: 0;">PikWizard</p>
</a>
</span>
</span>
Free (free of charge)
Free for personal and commercial use.
Author: Creative Art
Similar Free Stock Images

Premium


Premium


Premium


Premium


Premium


Premium


Premium


Premium


Premium


Premium


Premium


Premium


Premium


Premium


Premium


Premium


Premium


Premium


Premium


Premium


Premium


Premium


Premium


Premium

