- Home >
- Stock Photos >
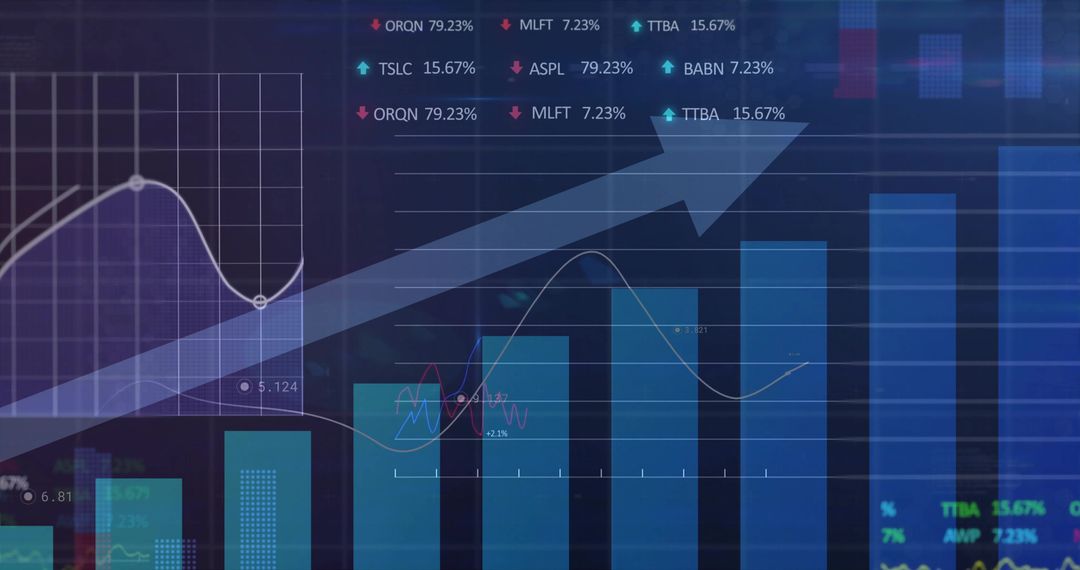
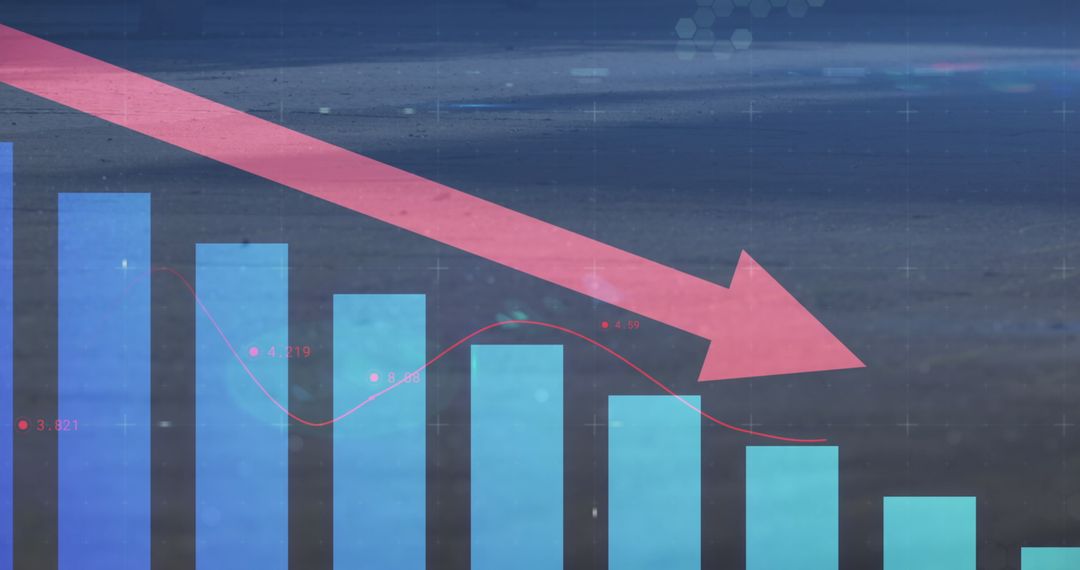
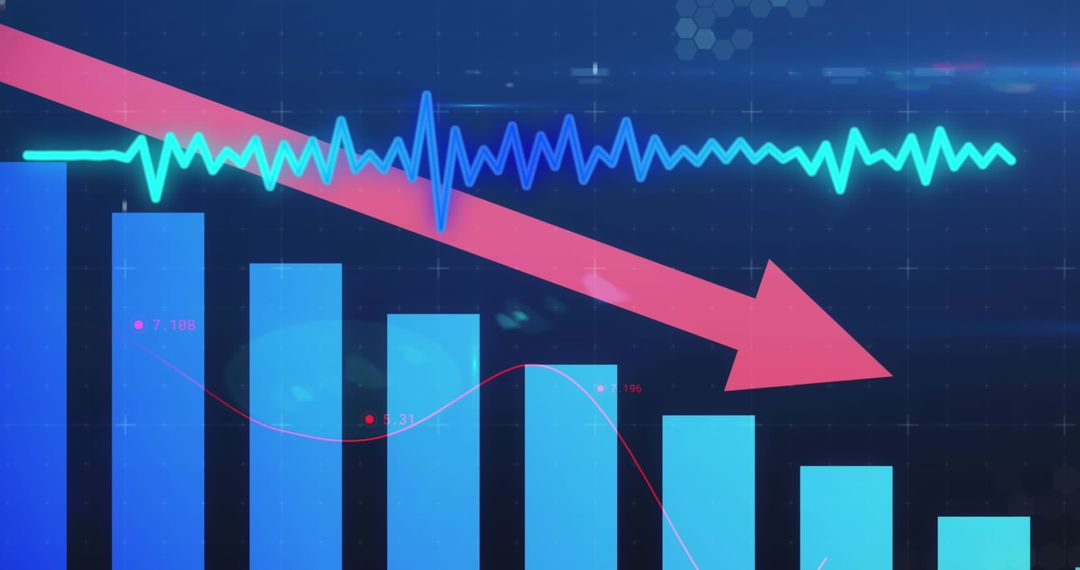
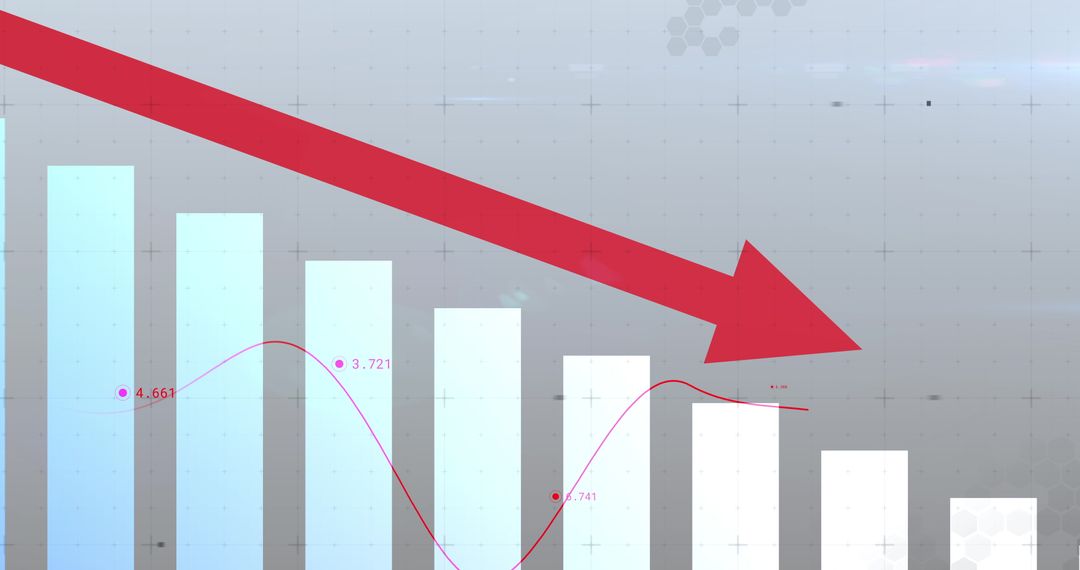
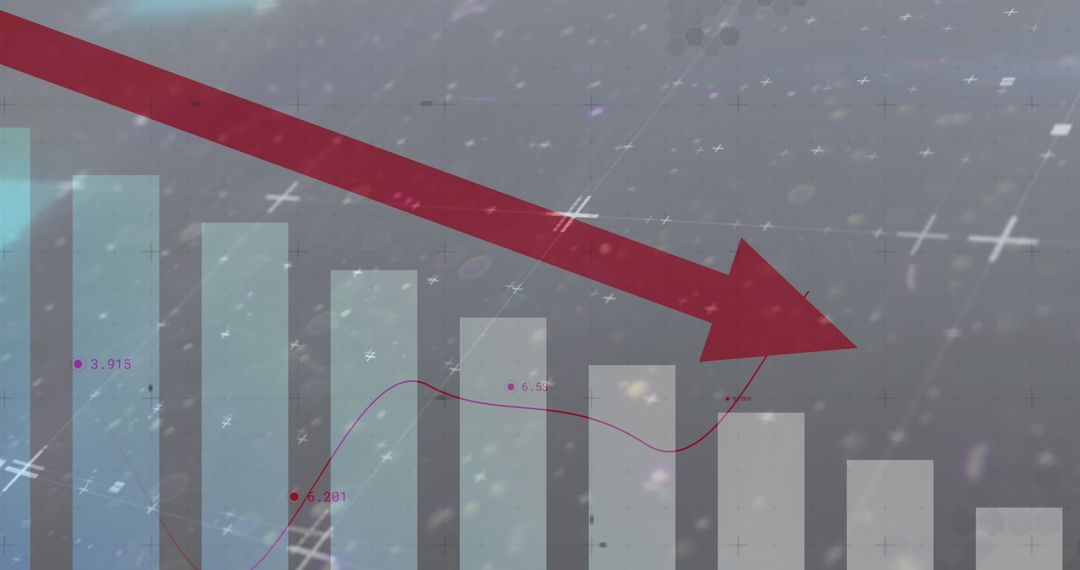
- Financial Data and Stock Market Decline Visualization
Financial Data and Stock Market Decline Visualization Image

Graphic representing a decline in financial data and stock market trends. A large red arrow signifies downward movement, accompanied by various graphs and bar charts displaying business analytics. This visualization is ideal for illustrating articles on financial forecasts, economic declines, and business strategy analysis.
Powered by 


2
downloads
downloads
Tags:
More
Credit Photo
If you would like to credit the Photo, here are some ways you can do so
Text Link
photo Link
<span class="text-link">
<span>
<a target="_blank" href=https://pikwizard.com/photo/financial-data-and-stock-market-decline-visualization/9623d4d751d4ee6ce766bedc35c4a46b/>PikWizard</a>
</span>
</span>
<span class="image-link">
<span
style="margin: 0 0 20px 0; display: inline-block; vertical-align: middle; width: 100%;"
>
<a
target="_blank"
href="https://pikwizard.com/photo/financial-data-and-stock-market-decline-visualization/9623d4d751d4ee6ce766bedc35c4a46b/"
style="text-decoration: none; font-size: 10px; margin: 0;"
>
<img src="https://pikwizard.com/pw/medium/9623d4d751d4ee6ce766bedc35c4a46b.jpg" style="margin: 0; width: 100%;" alt="" />
<p style="font-size: 12px; margin: 0;">PikWizard</p>
</a>
</span>
</span>
Free (free of charge)
Free for personal and commercial use.
Author: Awesome Content
Similar Free Stock Images

Premium


Premium


Premium


Premium


Premium


Premium


Premium


Premium


Premium


Premium


Premium


Premium


Premium


Premium


Premium


Premium


Premium


Premium


Premium


Premium


Premium


Premium


Premium


Premium