
- Home >
- Stock Photos >
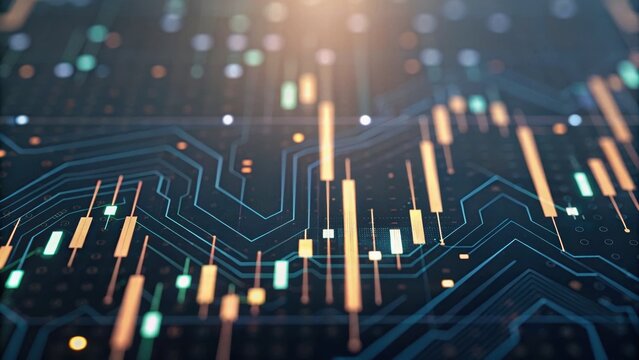
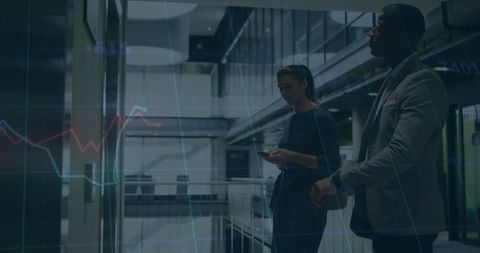
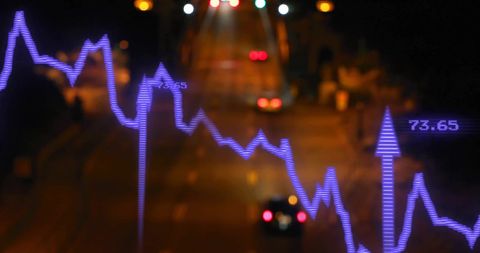
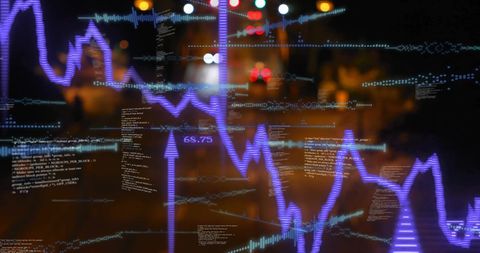
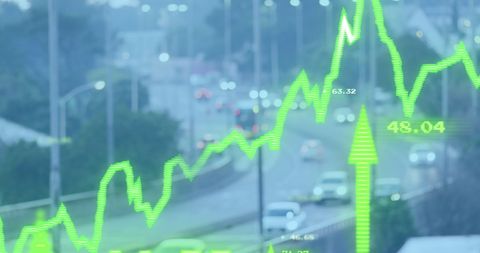
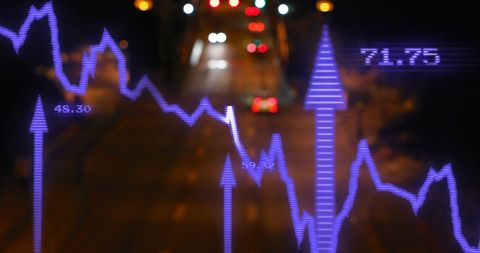
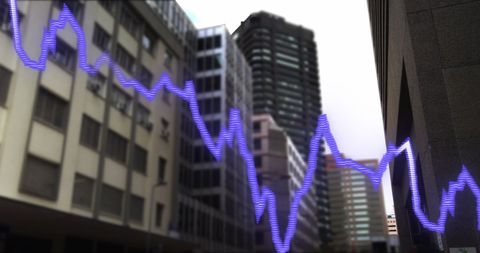
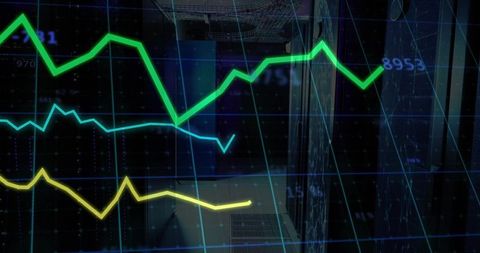
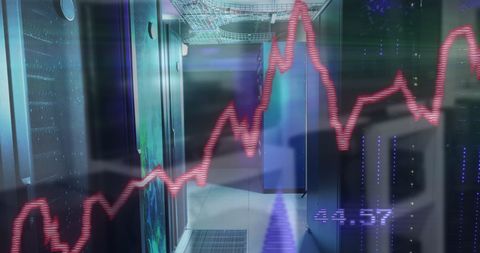
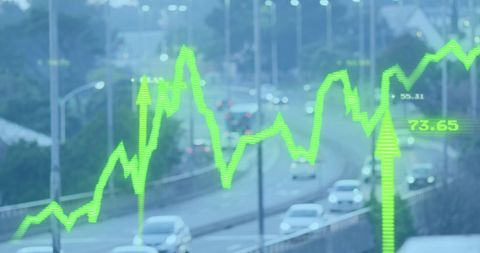
- Financial Data and Technology Interface in Server Room
Financial Data and Technology Interface in Server Room Image

This concept digitally generated displaying financial data processing in a server room highlights themes of global finance and business technology. It is ideal for illustrating articles on financial technology, modern computing power, or data analysis solutions in business contexts.
Powered by 


downloads
Tags:
More
Credit Photo
If you would like to credit the Photo, here are some ways you can do so
Text Link
photo Link
<span class="text-link">
<span>
<a target="_blank" href=https://pikwizard.com/photo/financial-data-and-technology-interface-in-server-room/d5b7677a4881de335fe55460475adfeb/>PikWizard</a>
</span>
</span>
<span class="image-link">
<span
style="margin: 0 0 20px 0; display: inline-block; vertical-align: middle; width: 100%;"
>
<a
target="_blank"
href="https://pikwizard.com/photo/financial-data-and-technology-interface-in-server-room/d5b7677a4881de335fe55460475adfeb/"
style="text-decoration: none; font-size: 10px; margin: 0;"
>
<img src="https://pikwizard.com/pw/medium/d5b7677a4881de335fe55460475adfeb.jpg" style="margin: 0; width: 100%;" alt="" />
<p style="font-size: 12px; margin: 0;">PikWizard</p>
</a>
</span>
</span>
Free (free of charge)
Free for personal and commercial use.
Author: Creative Art
Similar Free Stock Images

Premium


Premium

Premium


Premium


Premium


Premium

Premium

Premium


Premium


Premium


Premium


Premium


Premium


Premium


Premium


Premium


Premium


Premium


Premium


Premium

Premium


Premium


Premium


Premium


Premium


Explore More Free Stock Images