
- Home >
- Stock Photos >
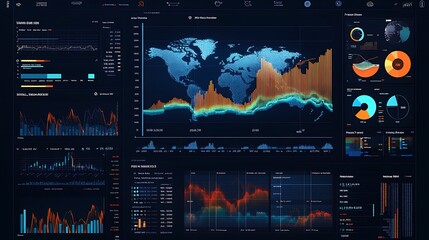
- Financial Data Chart on Digital Dashboard with Tickers and Analytics
Financial Data Chart on Digital Dashboard with Tickers and Analytics Image

Dynamic visualization combining green area graph and red line plot on finance-themed digital interface. Ideal for illustrating topics such as market analysis, investment strategies, and financial forecasting. Useful for presentations, reports on market trends, and financial educational materials.
Powered by 


downloads
Tags:
More
Credit Photo
If you would like to credit the Photo, here are some ways you can do so
Text Link
photo Link
<span class="text-link">
<span>
<a target="_blank" href=https://pikwizard.com/photo/financial-data-chart-on-digital-dashboard-with-tickers-and-analytics/e2f0d8e72bd3fd3cdbf2e03cd41f842b/>PikWizard</a>
</span>
</span>
<span class="image-link">
<span
style="margin: 0 0 20px 0; display: inline-block; vertical-align: middle; width: 100%;"
>
<a
target="_blank"
href="https://pikwizard.com/photo/financial-data-chart-on-digital-dashboard-with-tickers-and-analytics/e2f0d8e72bd3fd3cdbf2e03cd41f842b/"
style="text-decoration: none; font-size: 10px; margin: 0;"
>
<img src="https://pikwizard.com/pw/medium/e2f0d8e72bd3fd3cdbf2e03cd41f842b.jpg" style="margin: 0; width: 100%;" alt="" />
<p style="font-size: 12px; margin: 0;">PikWizard</p>
</a>
</span>
</span>
Free (free of charge)
Free for personal and commercial use.
Author: Creative Art
Similar Free Stock Images

Premium


Premium


Premium


Premium


Premium


Premium

Premium


Premium


Premium


Premium


Premium


Premium


Premium

Premium


Premium


Premium


Premium


Premium


Premium


Premium
Premium

Premium


Premium


Premium
Premium


Explore More Free Stock Images