- Home >
- Stock Photos >
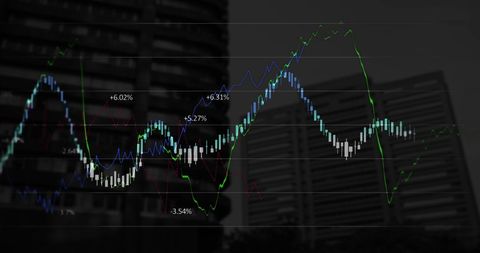
- Financial Data Chart Overlay on Urban Crane Scene
Financial Data Chart Overlay on Urban Crane Scene Image

This innovative illustration integrates financial stock market trends with an imagery of a construction crane and urban skyline, symbolizing the growth and development dynamics in urban settings. Ideal for presentations on economic trends, stock market analysis, business growth strategies, and urban development projects. Suitable for use in financial services marketing, graphics for consulting firms, educational illustrations for economics courses, and reports on real estate investment opportunities.
Powered by  - Get 15% off with code: PIKWIZARD15


2
downloads
downloads
Tags:
More
Credit Photo
If you would like to credit the Photo, here are some ways you can do so
Text Link
photo Link
<span class="text-link">
<span>
<a target="_blank" href=https://pikwizard.com/photo/financial-data-chart-overlay-on-urban-crane-scene/e84258f46fe6eb9a6a44196cb8808373/>PikWizard</a>
</span>
</span>
<span class="image-link">
<span
style="margin: 0 0 20px 0; display: inline-block; vertical-align: middle; width: 100%;"
>
<a
target="_blank"
href="https://pikwizard.com/photo/financial-data-chart-overlay-on-urban-crane-scene/e84258f46fe6eb9a6a44196cb8808373/"
style="text-decoration: none; font-size: 10px; margin: 0;"
>
<img src="https://pikwizard.com/pw/medium/e84258f46fe6eb9a6a44196cb8808373.jpg" style="margin: 0; width: 100%;" alt="" />
<p style="font-size: 12px; margin: 0;">PikWizard</p>
</a>
</span>
</span>
Free (free of charge)
Free for personal and commercial use.
Author: Creative Art
Similar Free Stock Images
Loading...

Premium


Premium

Premium


Premium


Premium


Premium

Premium

Premium


Premium


Premium

Premium

Premium


Premium


Premium


Premium


Premium


Premium


Premium

Premium


Premium

Premium

Premium

Premium


Premium


Premium